Hi,
I plot a time serie, along with a WheelZoomTool to zoom in & out (on the x_axis).
I’m trying to auto scale the y_range based on the line plot displayed.
I console.log the value of y_range.end before and after the emit.
It seems that in the JS code, the y_range.end is updated.
However, when I continue scrolling in/out, the y_range.end value keep the same, which means that the emit function did not propagated the update to the actual figure.y_range.
That is indeed what we observe, since the chart does not scale when zooming in/out.
Well, actually you need to describe the interaction you are looking for in detail. Do you mean scrolling the scroll zoom tool? Because by default that updates both ranges, so it would be competing / conflicting with anything in the JS callback. You would presumably want to restrict the scroll zoom to update only the x-axis and not touch the y-axis.
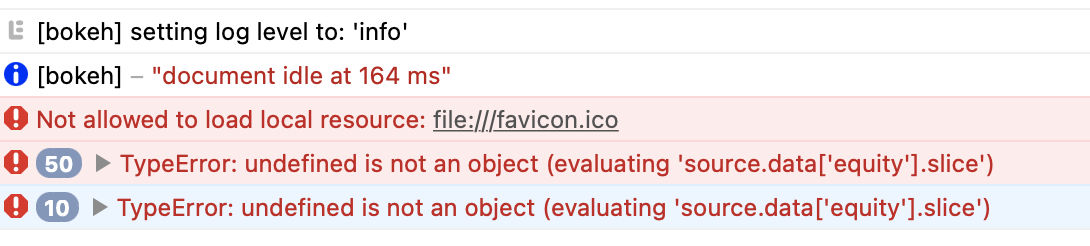
All that said, I am still a little confused by the behaviour and I am afraid I don’t have any immediate solutions for you. I will need to pare down the example more to investigate. Why are you slicing the CDS columns, for instance? What’s wrong with the full data being in the CDS, just part of it off-screen?
Hello Bryan,
When scrolling with the scroll zoom tool, by default, it zooms proportionately on both x & y axis.
What I’m trying to achieve, is to scroll on x_axis, and have y that auto scale in order to have a neat and accurate view of the data. So I set the scroll only on the x_axis (dimensions=‘width’), and I’m trying to make the change on the y_axis accordingly.
Here are couple of ideas that I implemented, but none was working for me:
I originally tried to slice the data, assuming bokeh would fit the y_axis based on the data.
with only a subset of the data in source, I thought it would focus on only those data.
I tried to work with the “only_visible=True” parameters of the axis
I tried to set start & end to None, to force an autofit
I tried to pass the whole figure as arg to CustomJS, and update figure.y_range.start / end there
From what I can see, the only thing that i’m not able to do, is to have the “y_range.change.emit();” to actually propagatee the change to the plot. It just seems like y_range is set at the beginning when creating the figure, and immutable from then.
If you have any idea, that I could investigate, please let me know.
@woody I think your computations are off. I don’t have any more time to look at this just now, but here is a simplified (working) version that updates the y-range to the min/max of the viewport data on a button push. I think you can use it as a reference:
import numpy as np
from bokeh.models import Button, ColumnDataSource, CustomJS
from bokeh.plotting import column, figure, show

x = np.linspace(0, 20, 200)
y = x**2

source = ColumnDataSource(data=dict(x=x, y=y))

p = figure(tools="xpan")
p.line("x", "y", source=source)

button = Button()
button.js_on_click(
    CustomJS(args={"xr": p.x_range, "yr": p.y_range, "source": source}, code="""
        const i = Math.max(source.data.x.findIndex((x) => x > xr.start), 0)

        const j0 = source.data.x.findIndex((x) => x > xr.end)
        const j = j0 >= 0 ? j0 : source.data.x.length - 1

        const ysub = source.data.y.slice(i, j)

        yr.start = Math.min.apply(null, ysub);
        yr.end = Math.max.apply(null, ysub);
    """)
)

show(column(p, button))
BTW you might want to trigger off of a RangesUpdate event instead of off of x_range.end. The former will provide a single combined event when any range change happens.
Bryan,
Thank you very much for your help. From your example, I was able to solve my problem.
It seems like triggering events from a range object (figure.x_range in my case) prevented to change the range value (y_range here).