However, I would like to improve it based on some color scheme that I came across in literature (which uses some other software to generate the matrix).
How do I go about modifying the code to obtain what I want using the tool I’m using? I believe the code for plotting starts from line # 1945 and I see that it imports certain colours from bokeh.palettes library.
I was primarily experimenting to see if I could even make it work without breaking the program, so I modified the code to change colors:
So my question here is if there is a way to implement the colour scheme that I want such that overlapping the colours merges them and gives a resulting chromatic colour?
Thanks.
Disclaimer: I’m a wet-lab biologist, so not really familiar with the inner workings of the software nor Python/Bokeh.
Hi @Sunil Bokeh more or less provides the following kinds of color mappers built-in:
categorical
linear
log
histogram-equalized
Are you saying that you need one of those kinds of colormapping, just with a different set of colors? If so, those colormappers all accept a palette, and a palette is literally nothing more than a sequence of color values. You can either pass one of the palettes defined in bokeh.palettes or you can pass any sequence of colors that you define yourself.
Alternatively, are you saying instead that you need some completely different kind of colormapping done (i.e. from some specialized algorithm). It’s not clear if that is the case, but if so, that’s a somewhat different discussion…
Thanks for your response. To be honest, I’m not really sure what the in-built colour mappers provide as it’s my first time tinkering with software. I did try looking up the palettes and trying to make some changes but didn’t work as well as I’d have wanted to.
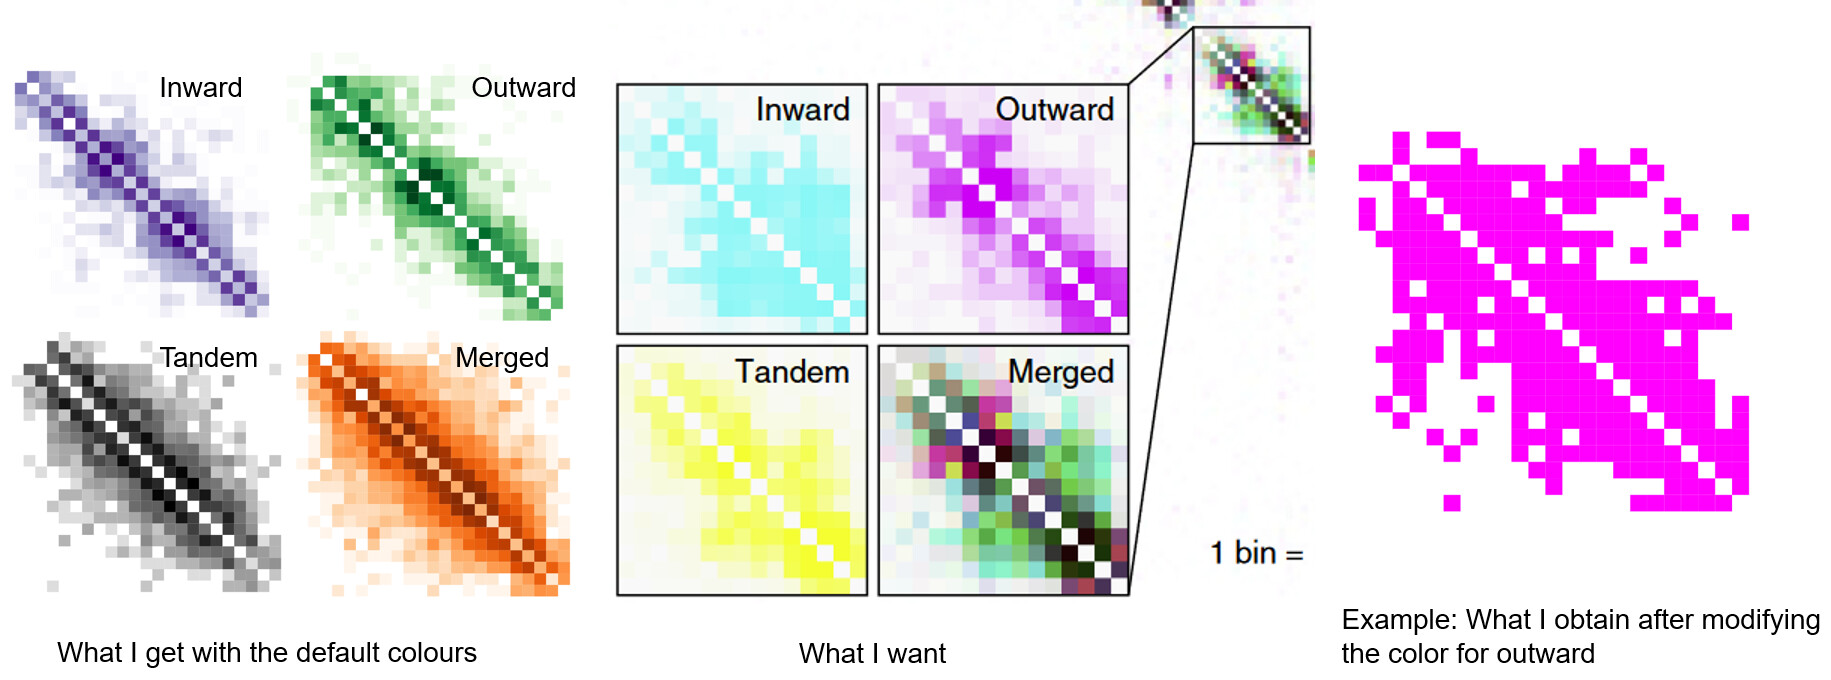
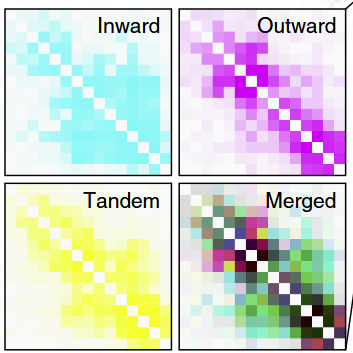
What I’m plotting here is 3 matrices for 3 different categories of data. What I want is to merge the colours in the fourth matrix to display the overlay of the 3 categories of matrices and that should result in displaying the merged colours.
For example, when overlaying data, merging cyan with yellow should result in green (as is visible in the center figure (merged matrix) of the screenshot in my original post).
I think it’s a CMYK format rather than RGB (please excuse my ignorance). Please let me know if this can be achieved through any of the palettes you mentioned.
When I modified the values for one of the categories, I did not obtain the color gradient. I believe it was because the colour was not a part of the palette used in the software. How do I go about solving this?
I don’t think any of the built-in colormappers will be useful for this specialized purpose. There are basically two options:
Colormap manually in Python
Bokeh has an image_rgba glyph that just accepts raw RGBA arrays as input and displays them as given. So one option is to bypass Bokeh’s colormappers entirely, and implement whatever specialized colormapping it is that you need in Python. Then you can pass the resulting RGBA array that you compute yourself directly to image_rgba.
This is probably the simplest option. But for completeness I will mention:
Implement a Custom extension
Here I have to point out that almost all of the actual work of Bokeh is actually done in a JavaScript library called BokehJS, in a browser, and not in Python. It’s possible to extend Bokeh with a new kind of colormapper by writing custom extension but this also means supplying all the necessary TypeScript code to implement the specialized colormapping you need. Custom extensions are an advanced topic and there are also not any strong JS API guarantees at this point (any extension code written today might have to be updated to keep working in the future).
I’ll also cc @James_A_Bednar1 and @Philipp_Rudiger since they may have input. They work on the Holoviz tools and have dealt with array colormapping from that angle. In case they don’t see this here, you might consider asking on the Holoviz Discourse
I think this is covered by ImageStack and WeightedStackColormapper. I’ve only used this in a Datashader context, via HoloViews, but I think the underlying Bokeh implementation does what you’re after, by doing a weighted sum across the various layers and creating an RGBA result.
Oh, right, @Ian_Thomas’s recent “stack” colormappers might apply. Unfortunately I am not aware of any pure Bokeh examples in the docs at the moment, so all I can do is point the the original Pull Request in case that is useful:
But it also depends on exactly what “merge” means in “I want to merge the colours in the fourth matrix”—if “merge” means something different than “colormap based on a weighted average of the other scalar arrays” then I think my reply above still holds.
Thanks @James_A_Bednar1, I’ll look into ImageStack an WeightedStackColormapper.
@Bryan Thanks for pointing out to the Pull Request. It’s something closer to what I want.
I’m copying the image and the line verbatim from the article that I’m following about what they are trying to convey about merging the colours in the resultant matrix:
The resultant inward, outward and tandem read matrices were colored in cyan, magenta and yellow, respectively, with certain color scales and then merged into one blended color matrix.