Use DataRange1d to compute plot bounds?

What are you trying to do?

I have a user-request to implement “scale binning” based on the plotted data. Let me elaborate on what that means as it’s a weird hybrid between Range1d and DataRange1d and best explained as an example:

If the computed bounds (it’ll have to be in both x and y dims but keeping it one dimensional for illustration) for a set of renderers are both between 0 and 10, I want to set the figure’s range to be from 0 to 10 (i.e. assign a Range1d w start/end 0/10. If the computed bounds change to say between 10 and 100, I want to hard set the figure’s range to 0 to 100.

Essentially I want 3-4 pre-cooked scales (e.g. 0-10, 0-100, 0-500 etc.), and based on the extent of the current renderers I want the appropriate scale selected and set.

What have you tried that did NOT work as expected?

My idea was:

Within a CustomJS callback that updates when the renderer data sources change → e.g. trigger it with renderer.data_source.js_on_change('data') for every renderer I want considered) …

//Instantiate a DataRange1d object and set its renderers property
var dr_ctr = Bokeh.Models._known_models.get('DataRange1d')
var dtr = new dr_ctr({renderers:renderers})
//assign that object to the figure's x_range
fig.x_range = dtr
//somehow trigger the datarange1d to compute the plot bounds/range 
//??????
//retrieve that range
var rng = [dtr.min,dtr.max] //might not be these props even but this info is stored on it
//then based on that range figure out what scale bin it falls into...
//then instantiate a Range1d model with that scale
//then assign that Range1d model to the figure's x_range

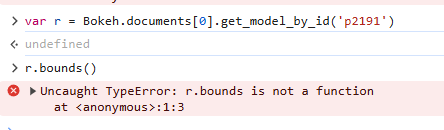
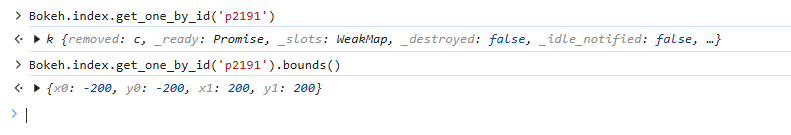
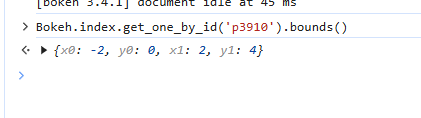
Where I’m lost (and I’ve looked deep into the BokehJS internals for DataRange1d to try and figure this out), is how the heck DataRange1d computes the range/bounds/extent and how to get it to do that successfully within a CustomJS callback. If I console.log(dtr) after assignment to the figure within the CustomJS, the min/max/start/end/_computed_bounds are all undefined/NaN.

I’ve tried .update() and I get an exception in _compute_plot_bounds because (I believe) it needs a Bounds type as the second argument:

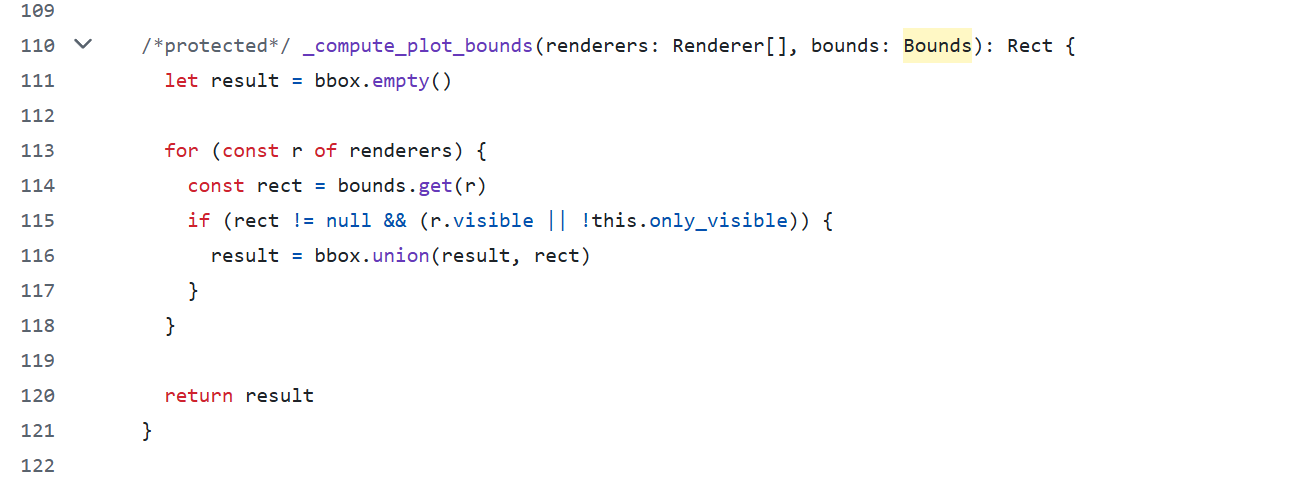
and that is undefined for my instantiated DataRange1d. This kinda indicates to me that I’m missing assignment of some key properties on my instantiation of DataRange1d (i.e. it needs more than just a renderers argument given to it). It’s either that, or I’m missing some method/function call I should do instead…

Any help/thoughts appreciated…

MRE / sandbox that might help anyone investigate…

from bokeh.plotting import figure, save
from bokeh.models import Range1d, DataRange1d, CustomJS, Slider
from bokeh.layouts import column

fig = figure(height=800,width=800)

r = fig.circle(radius=[10],x=[0],y=[0])

# fig.x_range = Range1d(start=-10,end=10)
# dr = DataRange1d(renderers=[r])

# fig.x_range.renderers = [r]

def setIntervalRange(fig,renderers):
    xr = Range1d()
    yr = Range1d()
    dr = DataRange1d(renderers=renderers)
    print(dr)
    cb = CustomJS(args=dict(xr=xr,yr=yr,fig=fig
                            ,dr=dr,renderers=renderers)
                  ,code='''
                  
                  const bbox = Bokeh.require('core/util/bbox') //maybe use this???
                  

                  var dr_ctr = Bokeh.Models._known_models.get('DataRange1d')
                  var dtr = new dr_ctr({renderers:renderers})
                  fig.x_range = dtr
                  
                  console.log(dtr)
                  dtr.initialize()
                  dtr.update()
                  
                  console.log(dtr)
                  
                  '''
                  )
    for rend in renderers:
        rend.data_source.js_on_change('data',cb)
    
setIntervalRange(fig=fig,renderers=[r])

#use slider to grow the circle's radius
sl = Slider(start=0,end=1000,step=10,value=10)
cb = CustomJS(args=dict(sl=sl,src=r.data_source)
              ,code='''
              src.data = {'radius': [sl.value], 'x': [0], 'y': [0]}
              src.change.emit()
              ''')
sl.js_on_change('value',cb)   

save(column(sl,fig),'C:/Repo/range_sel_fleshout.html')

@gmerritt123 this seems like a reasonable thing to want, but that no one has every happened to ask about previously. DataRange1d is actually probably one of the top-3 mosts complicated bits in Bokeh, so many things intersect there. I will have to dig into the code again myself since it’s been awhile. Offhand, I suspect that it may be simpler to come at things by asking the renderers yourself for their bounds so you can update a plain Range1d accordingly. The APIs you’d need to use for that may currently be private but we could also potentially look at making them more public/supported for the future. I’ll get back after I can dive in a bit more.

For an immediate reference that might be helpful to study, it’s actually inside the RangeMananger code where you can see how update is called with a bounds argument passed in:

bokeh/bokehjs/src/lib/models/plots/range_manager.ts at branch-3.7 · bokeh/bokeh · GitHub

There’s a lot of extra code in there to handle linear vs log, “follow” mode, hard bounds limits, etc. I think what you’d want to try to do is:

  • call renderer.bounds() on all the renderers you care about
  • union all those separate bounds Rects together
  • use that result to determine which of your “fixed” range extents to use
  • update your Range1ds with those extents

You’d need to decide when to trigger a CustomJS for that. Maybe you have a widget change that applies, or a CDS data change, etc.

. DataRange1d is actually probably one of the top-3 mosts complicated bits in Bokeh

You’re not kidding :sweat_smile:

  • call renderer.bounds() on all the renderers you care about
  • union all those separate bounds Rects together
  • use that result to determine which of your “fixed” range extents to use
  • update your Range1ds with those extents

Yes this is 100% what I need! My problem is just the first bullet → In my MRE above at least, it doesn’t appear that renderer.bounds() is a function/method though…


^^ where model p2191 is the renderer using the circle glyph in my MRE. Am I missing something simple here?

Thanks for getting back to me so quick.

I believe bounds is actually a method on the renderer view. I think there was a PR awhile back that made getting ahold of views a little easier:

Make it easier to reference models' views by mattpap · Pull Request #13351 · bokeh/bokeh · GitHub

I think you’d want Bokeh.index.get_by_id but maybe @mateusz can comment for certain.

oh wow…thanks. this might be promising then →

1 Like

As an aside if you get this working then I’d suggest opening an issue to request making a firm commitment to avoid any future breaking changes to the bounds() API. We can at least add a comment to it to note that users are for-sure using it in the wild and changes would be breaking for them.

1 Like

Ok, will report back when I do… yeah it looks like I’m gonna have to rely on Bokeh.index ... in the CustomJS which yeah I know is dangerous/unstable. Again thanks for your help.

I’m not sure I know that, but that’s definitely a good question for @mateusz to comment any best practices

Alright, I’m back to this now…

It seems like .bounds() (and consequently compute_bounds) etc. is not completely robust for all glyphs. As a result, you can see even in example docs that the DataRange1d doesn’t actually match the viewable extent of particular renderers.

For example, with Annular Wedge → using Annular Wedge — Bokeh 3.6.2 Documentation , you can see that the DataRange1d models that govern the plot xy bounds do NOT follow the true extent of the renderer. e.g. including the inner/outer spec’d radii for the annular wedge, but rather just its x-y locations:

And if I call Bokeh.index.get_model_by_id('pXXXX').bounds() in the JS console using this (slightly modded from the above example) MRE:

import numpy as np

from bokeh.plotting import figure, show
from bokeh.models import AnnularWedge, ColumnDataSource

N = 9
x = np.linspace(-2, 2, N)
y = x**2
r = x/12.0+0.4

source = ColumnDataSource(dict(x=x, y=y, r=r))

plot = figure()

glyph = AnnularWedge(x="x", y="y", inner_radius=.2, outer_radius="r", start_angle=0.6, end_angle=4.1, fill_color="#8888ee")
rend = plot.add_glyph(source, glyph)

print(rend.id)
show(plot)

This is confirmed:

I kinda took for granted/hoped that compute_bounds would just “magically” know how to get the “true” renderer’s extent across all glyph types (and by “magically” I mean painstakingly accounted for/written by @mateusz et al in the back-end :smiley: ). This assumption of mine was based primarily on seeing it “work” correctly for patches, polygons and multiline glyphs which are obviously "special’ in terms of computing renderer extent)… but it appears this is not the case :frowning:

I’m wondering if we have a way of knowing which glyphs this “gap” pertains to… is it anything with a radius/width (spec’d in data units)? Or is it more than that? Is this github issue/feature request material?

c.f. Auto-ranging for wedges (and single circles?) · Issue #11082 · bokeh/bokeh · GitHub

IIRC there was originally a question of whether to compute a bounding box based for the “full” circle that a wedge is part of or not—that would be trivial to do but might lead to surprising results for “slim” wedges that only account for a fraction of that circle. Alternatively it might be better to compute a “tight” bounding box around the wedge. I don’t think that would be all that much more difficult, but evidently the question led to indecision and things falling off the radar.

Currently, all the “center rotatable” glyphs like wedges inherit the default spatial indexing, which just adds the (x, y) points:

i.e. these glyphs just behave like point scatter glyphs for purposes of bunds computation. The task here would be to provide a more specialized _index_data for wedges, etc. At this point, I guess I don’t really care about the original question and think any reasonable approach would do.

Here’s the result just with “loose” bounds, i.e. just using the entire implied circle:

1 Like
1 Like

Awesome thanks so much for the quick implementation :smiley: . Yeah, I totally get the whole “full circle or tight to the wedge” debate/question. For my specific use case I’m using AnnularWedge to basically draw a singe bullseye (yes I’m aware Annulus exists… might switch it out now):

So “around the full wedge circle” would be the exact same as “around the just the wedge itself” for me anyway.

This will cover any glyph with a radius eh? Wondering about any other oddball glyphs, like ellipse or rect/quad/block.

This will cover any glyph with a radius eh?

I’ll be precise and state that I added codepaths for annulus, wedge, and annular_wedge. Other “radial” glyphs that are i) radially symmetric with ii) a single radius (i.e. not “inner” and “outer”) should already be covered by inheriting from RadialGlyph. But if something has been missed a new issue would be best.

Wondering about any other oddball glyphs, like ellipse or rect/quad/block.

All of the axis-aligned box glyphs should already be fully covered by an implementation in a common base class that inserts exact bounds for every box in the spatial index.

The center-rotatable glyphs like ellipse and rect do also have an index implementation, but it could probably use some improvement. IIRC it computes single “max” width and height values for all the rects and ellipses, and uses those conservative overestimates for every entry in the index. In case you’d be curious to take a look, this is the relevant code:

bokeh/bokehjs/src/lib/models/glyphs/center_rotatable.ts at 1c9a054ca106b7b2c9232bff3d7fcf5f434583fc · bokeh/bokeh · GitHub

Basically that could be replaced with a real _index_data implementation like I added in the other PR.