Use HoverTool for some glyphs but not others in a plot?

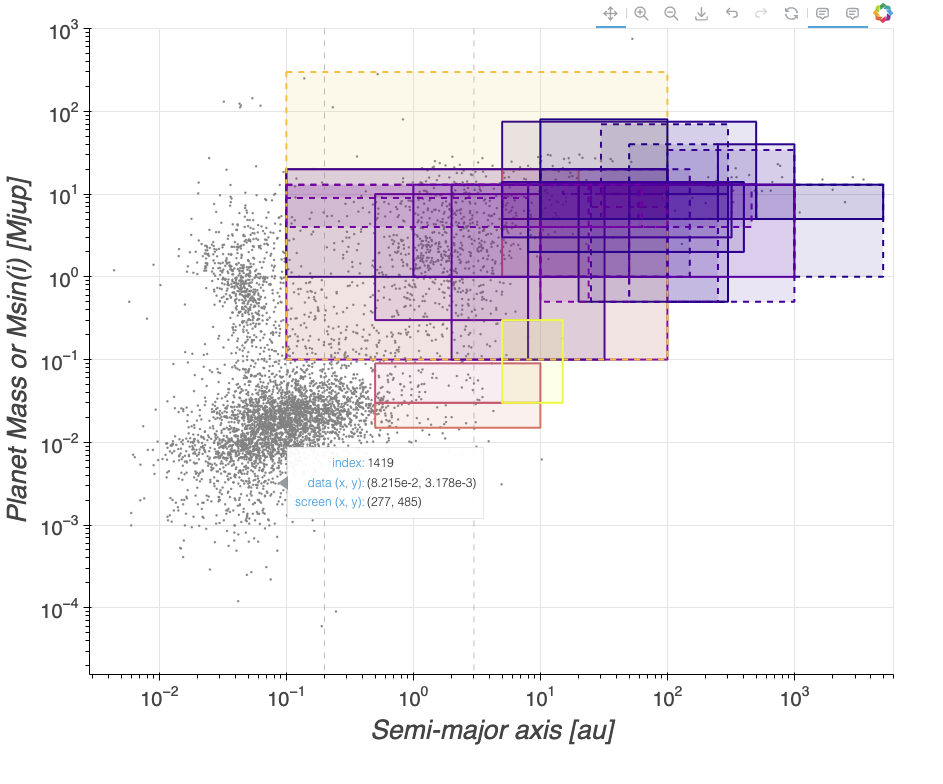
Hello, I am trying to create a plot with HoverTool inspections for only some of the glyphs and not others. I have a plot with a scatter plot of points, and several rectangles overlaid over the points. I want to have it such at hovering over the rectangles displays tooltips information, but hovering over the points does not. The rectangles are the key feature of the plot but the points are needed for context.

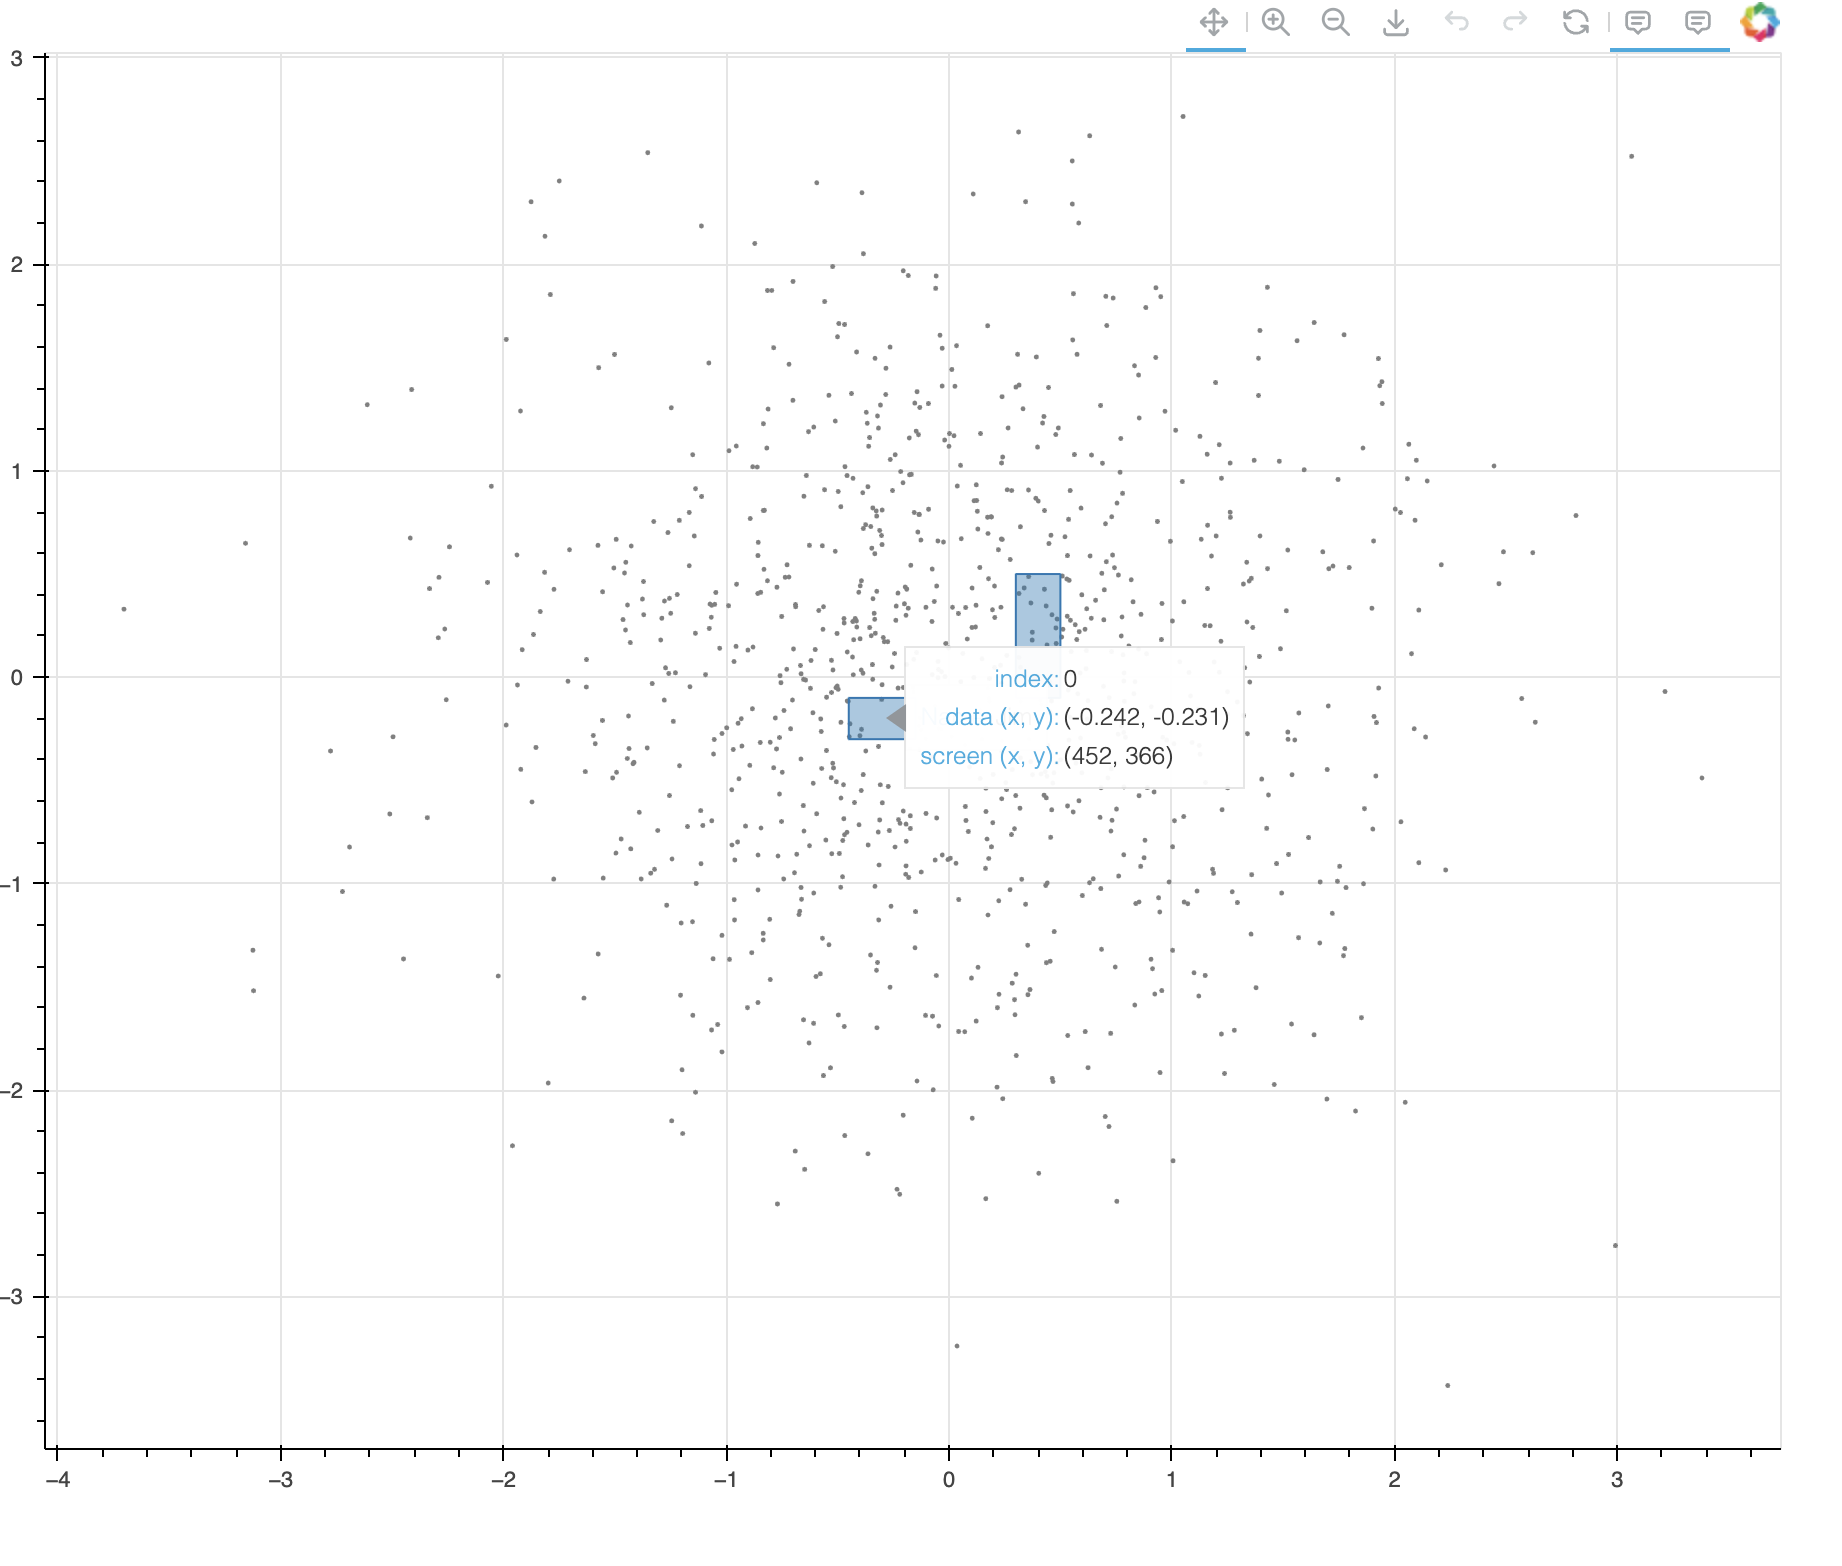
Here I have generated a minimal reproducible example with some dummy data, and screenshot of what it renders. Currently it’s not even showing the thing I want it to show, the name of each rectangle. But it also shows info when the dots are hovered over as well.

I appreciate any guidance on how to display just the rectangle names without also displaying hover info for the dots as well. I’ve done a good amount of googling and trial and error and can’t figure it out.
Cheers.

from bokeh.plotting import figure, show, output_file, save
from bokeh.models import HoverTool
import numpy as np

datadict={
    'x':np.random.normal(size=1000), 'y':np.random.normal(size=1000),
    }

data=ColumnDataSource(data=datadict)

datadict2={'RectCentersX':[-0.3,0.4], 'RectCentersY':[-0.2,0.2],
    'RectWidths':[0.3,0.2], 'RectHeights':[0.2,0.6],
    'RectNames':['Jim','Bob']}
data2=ColumnDataSource(data=datadict2)

tools = "hover, zoom_in, zoom_out, save, undo, redo, reset, pan"
tooltips = [
    ('Name', '@RectNames')
]

hover = HoverTool(mode='mouse', line_policy='nearest',
    tooltips=tooltips)

p1 = figure(width=900, height=750,
           tools=[tools, hover], toolbar_location="above")

p1.circle('x','y', source=data, color='grey', size=1.5)

p1.rect(source=data2, x='RectCentersX', y='RectCentersY', width='RectWidths', height='RectHeights', 
        width_units="data", height_units="data", fill_alpha = 0.4)

show(p1)

@Logan_Pearce You can use renderers argument to indicate which renderers to hit against, hence this way you can exclude glyphs that you do not want the hover tool to hit against.

rect_r = p1.rect(source=data2, x='RectCentersX', y='RectCentersY', width='RectWidths', height='RectHeights', 
        width_units="data", height_units="data", fill_alpha = 0.4)

tooltips = [
    ('Name', '@RectNames')
]
hover = HoverTool(mode='mouse', line_policy='nearest',
    tooltips=tooltips, renderers=[rect_r]
    )

p1.add_tools(hover)

I have not include hover in your tools text string and in the figure argument tools . Instead I use add_tools on the figure object.

2 Likes

I made that change, thank you. And that works nicely for getting the hover tool over the rectangles, but I am still getting a box popping up when hovering over a dot.

Here is my full code and the plot that results, showing the hover box that pops up over a grey dot. Ultimately I don’t want anything to pop up when hovering over a dot, only over the rectangles. Any clue what I might be doing wrong?

datadf = pd.DataFrame(data={'plotx':pl['pl_orbsmax'], 'ploty':pl['pl_bmassj'],
                            'color':df['Fraction']/100, 
                            'Ref':df['Reference'], 'Sep':df['Sep [AU]'], 
                            'Mass':df['Mass [Mjup]'], 'OccRate':df['f %'],
                            'Sep upper':df['Sep upper'], 'Sep lower':df['Sep lower'],
                            'Mass upper':df['Mass upper'], 'Mass lower':df['Mass lower'],
                            'RectCentersX':df['RectCentersX'], 'RectCentersY':df['RectCentersY'],
                            'RectWidths':df['RectWidths'], 'RectHeights':df['RectHeights'], 
                            'LineStyles':df['LineStyles']
                            
                           })
datadict = datadf.to_dict(orient = 'list')

from bokeh.plotting import figure, show, output_file, save
from bokeh.io import output_notebook
from bokeh.models import LinearColorMapper, ColumnDataSource, LinearInterpolator
from bokeh.models import  Range1d, LabelSet, Label, ColorBar, FixedTicker, Span
from bokeh.models import CustomJS, Slider, HoverTool, Rect
from bokeh.layouts import column, row
from bokeh.palettes import Magma256, Turbo256, brewer, Plasma256
from bokeh.transform import linear_cmap
#output_notebook()


data=ColumnDataSource(data=datadict)


tools = "hover, zoom_in, zoom_out, save, undo, redo, reset, pan"
tooltips = [
    ('Ref', '@Ref'),
    ('Occ. Rate', '@OccRate'),
    ('Sep Range [AU]', '@Sep'),
    ('Mass Range [Mjup]','@Mass'),
]


p1 = figure(width=900, height=750, y_axis_type="log", x_axis_type="log",
           tools=tools, toolbar_location="above")

circles = p1.circle('plotx','ploty', source=data, color='grey', size=1.5)

mapper = linear_cmap(field_name='color', 
                     #palette=brewer['PuOr'][ncolors],
                     palette=Plasma256,
                     low=0, high=1)

color_bar = ColorBar(color_mapper=mapper['transform'], width=15, 
                     location=(0,0), title="Phase",
                    title_text_font_size = '20pt',
                     major_label_text_font_size = '15pt')


alpha = 0.1
ls = 'solid'
lw = 2
rect_r = p1.rect(source=data,x='RectCentersX', y='RectCentersY', width='RectWidths', height='RectHeights', 
                width_units="data", height_units="data", 
               line_color=mapper, color=mapper, fill_alpha=alpha,
              line_dash = "LineStyles", line_width = lw)

hover = HoverTool(mode='mouse', line_policy='nearest',
    tooltips=tooltips, renderers = [rect_r])

p1.add_tools(hover)


line1 = Span(location=3,dimension='height', line_color='grey',
                              line_dash='dashed', line_width=0.5)
line2 = Span(location=0.2,dimension='height', line_color='grey',
                              line_dash='dashed', line_width=0.5)
p1.add_layout(line1)
p1.add_layout(line2)

label1 = Label(x=35, y=0, text='Approx. Loc. of Snowline \n of Sun-like star',
                      x_offset=20, y_offset=-20,text_font_size = '20pt')
label2 = Label(x=0.23, y=0, text='Approx. Loc. of Snowline \n of low-mass M star',
                      x_offset=20, y_offset=-20,text_font_size = '20pt')
p1.add_layout(label1)
p1.add_layout(label2)


p1.xaxis.axis_label = 'Semi-major axis [au]'
p1.yaxis.axis_label = 'Planet Mass or Msin(i) [Mjup]'
p1.xaxis.axis_label_text_font_size = '20pt'
p1.yaxis.axis_label_text_font_size = '20pt'
p1.yaxis.major_label_text_font_size = "15pt"
p1.xaxis.major_label_text_font_size = "15pt"


show(p1)

@Logan_Pearce you see the hover information for everything because you initially include hover in your tools figure argument

That’s why I commented that in my previous post. You need to define the tools initially without a hover

tools=“zoom_in, zoom_out, …”
1 Like

Ah yes that solved it! Thank you! I did so much google searching for this and never found this simple solution. Thanks a bunch!