hello!! I am working on a memory utilization bar graph. The graph itself shows memory utilization in percentage. When I hover over each bar, I would like it if it shows the total memory and used memory number - both are used to derive the percentage but not part of data for the graph itself. From my online searches, I cant find an example I can understand (beginner here). could someone give me a hint?
What I have below was what I could figure out from online resources - when I hover, it displays the label and the percent of memory used. I need to get it to display other info like mem_total and mem_available (I can put them into a list) instead.
# figure 8
mem_percent_label = ['MemUsed', 'SwapUsed', 'CMAUsed']
mem_percent = [0,0,0]
mem_total = get_mem('MemTotal')
swap_total = get_mem('SwapTotal')
cma_total = get_mem('CmaTotal')
mem_plot_hbar = figure(y_range=mem_percent_label, plot_width=800, plot_height=300, title='Memory Usage')
mem_plot_hbar.xaxis.axis_label = '%Used'
mem_plot_hbar.yaxis.axis_label = 'Memory type'
mem_percent_ds = (mem_plot_hbar.hbar(y=mem_percent_label, right=mem_percent,
tags = mem_percent_label,
height=.5, fill_color='steelblue',
hatch_pattern='vertical_line', hatch_weight=2, line_width=0)).data_source
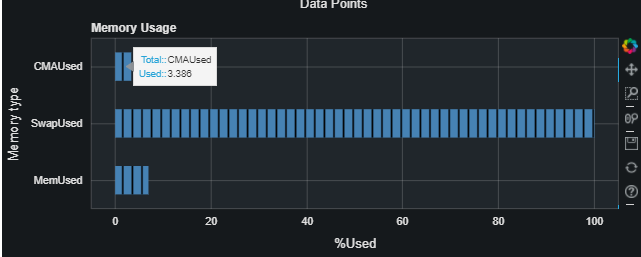
hover = HoverTool(tooltips=[("Total:", "@y"), ("Used:", "@right")])
mem_plot_hbar.add_tools(hover)
@linear()
def update(step):
mem_total = get_mem('MemTotal')
mem_available = get_mem('MemAvailable')
swap_total = get_mem('SwapTotal')
swap_free = get_mem('SwapFree')
cma_total = get_mem('CmaTotal')
cma_free = get_mem('CmaFree')
global mem_percent
mem_percent[0] = 100 - mem_available * 100 / max(mem_total, 1)
mem_percent[1] = 100 - swap_free * 100 / max(swap_total, 1)
mem_percent[2] = 100 - cma_free * 100 / max(cma_total, 1)
mem_percent_ds.trigger('data', mem_percent_label, mem_percent)
curdoc().add_root(mem_plot_hbar)
curdoc().add_periodic_callback(update, 1000)
this is the current output: