Using multiplotting and some widgets

I can’t understand how to plot n-lines and n-vareas on the same graph and using at the same time some widgets. For example Slider.
I am a geophisist and trying to create seismogram plotter like on the image bellow.


All of this lines and vareas are uniqe. And i want to make some kind of slider “gain” to increase the amplitude of all this lines and vareas. Of course i have done this for one trace and i dont mind how to do that for all.
Data type loking like this data.shape = (Num of tracks,Num of samples(“y”),Num of samles(“x”))
An ideal help would be to represent the code in which n lines (for exmpl sin)abd vareas which are built from an array of type numpy with the ability to use slider to increase amplitude of all this line at the same time.
I cannot attach the original code because there are a lot of unnecessary processes that are not related to the essence of the issue.
And sorry for my english)

I cannot attach the original code

Can you create a minimal example that does everything crucial to your question, with a data sample?

import math
import numpy as np
from collections import deque
from bokeh.layouts import gridplot,column, row
from bokeh.io import  show
from bokeh.plotting import figure,show,ColumnDataSource
from bokeh.models import CustomJS,Slider

#CREATING
def Shifting (tr,delta):
    tr_new = np.zeros(len(tr))
    d = deque(tr)
    d.rotate(int(-delta))
    tr_new = np.array(d)
    return tr_new

b=-2
w=2
t=np.arange(0,100)
n=2

W=np.zeros(len(t))
for i in range(len(t)):
    W[i]=(t[i]**n)*math.exp(-b*t[i])*np.sin(w*t[i])
W1=W/W.max()
W_v1=np.where(W>0,W,0)

WWW=[]
for i in range(5):
    a=Shifting (W1,i*20)
    b=np.where(a>0,a,0)
    WWW.append((a,b,t))
    
Vareas_mass=[]
Trace_mass=[]
Time_mass=[]
for k in range(5):
    Traces=Shifting (W1,k*20)
    Vareas = np.where(Traces>0,Traces,0)
    Trace_mass.append(Traces)
    Vareas_mass.append(Vareas)
    Time_mass.append(t)    
#PLOTTING    
plot = figure(plot_width=1600, plot_height=800)
source = ColumnDataSource(data=dict(Trace_mass=Trace_mass,Vareas_mass=Vareas_mass,Time_mass=Time_mass))   
gain_slider = Slider(start=-0.1, end=0.1, value=0., step=0.001, title="Gain",default_size=(50))
data=source.data

for n in range(len(data['Time_mass'])):
    plot.line( source.data['Trace_mass'][n]+n*2,source.data['Time_mass'][n],color='black') 
    plot.varea(source.data['Vareas_mass'][n]+n*2,source.data['Time_mass'][n],n*2)

callback = CustomJS(args=dict(source=(source) , gain=gain_slider),
                    code="""

    var data = source.data;
    var G = gain.value;
    var Time_mass = data['Time_mass']
    var Trace_mass = data['Trace_mass']
    var Vareas_mass = data['Vareas_mass']
    for (var i = 0; i <  Time_mass.length; i++) {
        for (var j = 0; j <  Time[i].length; j++) {
        Trace_mass[i][j]+=Trace_mass[i][j]*G;
        Vareas_mass[i][j]+=Vareas_mass[i][j]*G;
      }  
    }
    gain.value=0
    source.change.emit();

""")

gain_slider.js_on_change('value', callback)

layout = row(
plot,
column(gain_slider),
)

plot.y_range.flipped = True
show(layout) 

Hi @KonradCurze you can edit your post to use code formatting, either with the </> icon on the editing toolbar, or by typing triple backtick ``` fences on lines before and after the entire code block

I tried a million times and it finally worked. Thanks. In the future, such stupid problems will not arise

If you open your broser’s JavaScript console and move the slider, you will see that there are multiple errors there like this one:

Uncaught ReferenceError: Time_mass is not defined

Your CustomJS code does use Time_mass but it’s never defined. What is it supposed to be?

I apologize. I rewrote the code above. But that doesn’t solve the problem. This is purely my typo.

It seems to me that the whole problem is either in the incorrect assignment of plots, or in the assignment of a variable source, or simply in what is as stupid as possible.
I think it’s just inconsistent to set so many lines and vareas in this format.

Well, you code still doesn’t run because now it’s Time that’s not defined. :slight_smile: But that was easy to fix, so no problem there.

Three major issues:

  • You’re creating a data source but you’re not using it to supply data to the renderers. For the details, consult this documentation section: Providing data — Bokeh 2.4.2 Documentation
  • You’re changing the data in-place - due to the floating point arithmetic precision issues, you will never be able to get to where you started, the errors will accumulate gradually with each slider interaction. Given that your numbers are small as it is, this is definitely a concern. Instead of changing the data itself, create transformations and change their parameters: Providing data — Bokeh 2.4.2 Documentation
  • In the callback, you’re setting slider.value back to 0. The slider is essentially unmovable

Okay. Here are my answers.

  • I cannot normally use the source data in a similar form as on the link.
    Providing data — Bokeh 2.4.2 Documentation
    All because the data is not two-dimensional. For each trace, I have my own three arrays of amplitudes, times and glyphs. They can have different lengths from track to track. Therefore, I cannot write something like this
for i in range(len(source.data['Time_mass']))
    plot.line('Trace_mass'[i],'Time_mass'[i],source=source,color='black') 
    plot.varea('Vareas_mass'[i],'Time_mass'[i],0,source=source)

Therefore, I write so that at least something is drawn. But of course this is wrong because of “You’re creating a data source but you’re not using it to supply data to the renderers.”

data=source.data
for n in range(len(data['Time_mass'])):
    plot.line( source.data['Trace_mass'][n]+stoffset[n],source.data['Time_mass'][n],color='black') 
    plot.varea(source.data['Glyph_mass'][n]+stoffset[n],source.data['Time_mass'][n],stoffset[n])
  • The second point is really good. However, I am faced with a past problem and the inability to access the source, to the traces one by one, as in cycle over indices.
    Most likely I am creating the source incorrectly. I don’t know how to create a source for non-two-dimensional arrays. Perhaps i need to completely abandon the current rendering and use some special function for multilines. This is a question.

  • And about the last one. I did it on purpose. Because for me the slider movement is not necessary. All i need is animation. Which is not done, of course) I would like to use a spring animation. You pull back the slider, and when released, it returns to its original zero position. But I don’t know how to do it either. This is also a question.
    And the spring is needed because of these lines.

        Trace_mass[i][j]+=Trace_mass[i][j]*G;
        Vareas_mass[i][j]+=Vareas_mass[i][j]*G;

If the user passes through 0 when moving the slider, it will be sad.
If the user moves the slider back and forth in the positive, for example, part, then the amplitude will constantly increase.
In fact, this is the same as the + and - buttons, but the slider is still smooth and you don’t need to press non-permanently, just move it. It’s pretty important and convenient for my work.

I think my problem is pretty important for title “Using multiplotting and some widgets” .
I searched for some examples on the Internet for a long time and was surprised that there was nothing like that. It would be very helpful for the community to have an example for rendering multiple lines and glyphs with the ability to use widgets. This is because bokeh is a very cool and fast library for a plotting large number of lines and some widgets, unlike matplotlib notebook for exmpl.
An example of some series of curves with the possibility of increasing amplitudes, adding glyphs or plotting additional curves on a graph with changing all of them at the same time is quite important in my opinion and not only for my task.
For example, to study a physical experiment carried out at the same time and in the same place but under different conditions, it is important to trace the details and differences in real time. And to simplify these operations, it is important to have simple functions such as increasing the amplitude or just adding glyphs. Further more difficult of course. You can view the spectra for signal filtering, access other data in additional windows, and so on. Therefore, I’m trying to figure it out in bokeh. It’s fast and beautiful)

Why not just unroll all those arrays? So e.g.

dict(Trace_mass=[[0, 1], [1, 2]])

becomes

dict(Trace_mass_0=[0, 1], Trace_mass_1=[1, 2])

If you don’t have dynamic column lengths right now then this is the solution, I’m pretty sure.

I took the advice and corrected the code. Now at least something works. However, there are problems.

  • Without pressing the slider, the traces are drawn on top of each other. How to fix it?

  • The speed is extremely low. Please tell me how and what to fix in order to significantly increase rendering. I tried on more curves and the drawing is very slow. Is it really possible to do this, or is it better to look for other ways?

  • And what should I do with source if i have dynamic column lengths

  • And in general, are there any serious problems or not.

Here is the code

import math
import numpy as np
from collections import deque
from bokeh.layouts import gridplot,column, row
from bokeh.io import  show
from bokeh.plotting import figure,show,ColumnDataSource
from bokeh.models import CustomJS,Slider

def Shifting (tr,delta):
    tr_new = np.zeros(len(tr))
    d = deque(tr)
    d.rotate(int(-delta))
    tr_new = np.array(d)
    return tr_new


b=-2
w=2
t=np.arange(0,100)
n=2

W=np.zeros(len(t))
for i in range(len(t)):
    W[i]=(t[i]**n)*math.exp(-b*t[i])*np.sin(w*t[i])
W1=W/W.max()
W_v1=np.where(W>0,W,0)

Vareas_mass=[]
Trace_mass=[]
Time_mass=[]
for k in range(5):
    Traces=Shifting (W1,k*20)
    a=np.where(Traces>0,Traces,0)
    Trace_mass.append(Traces)
    Vareas_mass.append(a)
    Time_mass.append(t)    
#PLOTTING    
Num_of_traces=len(Trace_mass)
Dict_mass={}
Dict_mass.update({'Trace_mass_{number}'.format(number=i):Trace_mass[i] for i in range(Num_of_traces)})
Dict_mass.update({'Time_mass_{number}'.format(number=i):Time_mass[i] for i in range(Num_of_traces)})
Dict_mass.update({'Vareas_mass_{number}'.format(number=i):Vareas_mass[i] for i in range(Num_of_traces)})


plot = figure(plot_width=1600, plot_height=800, x_range=(-5, 13))
source = ColumnDataSource(data=Dict_mass)   
source_copy=ColumnDataSource(data=Dict_mass)   


gain_slider = Slider(start=-99., end=100., value=1., step=0.01, title="Gain",default_size=(300))


for i in range(Num_of_traces):
    plot.line('Trace_mass_{number}'.format(number=i),'Time_mass_{number}'.format(number=i),source=source,color='black') 
    plot.varea('Vareas_mass_{number}'.format(number=i),'Time_mass_{number}'.format(number=i),i*2,source=source)

callback = CustomJS(args=dict(source=source,source_copy=source_copy , gain=gain_slider),
                    code="""
    function maxElement (list){
    let max;
    let min = list[0];
    for(let i = 0; i < list.length; i++){
        if((list[i]) < min){
            min = list[i]; 
        } else {
            max = list[i];
        }
    }
    return max;
    }     
    

    var data = source.data;
    var data_copy = source_copy.data
   
    source.change.emit();
    var G = gain.value;
    
    for (var i = 0; i <  Object.keys(data).length/3; i++) {
        var s=String(i)
        var Trace_mass_copy = data_copy['Trace_mass_'+i]
        var Vareas_mass_copy = data_copy['Vareas_mass_'+i]
        var Trace_mass = data['Trace_mass_'+i]
        var Vareas_mass = data['Vareas_mass_'+i]
        

        for (var j = 0; j <  Trace_mass.length; j++) {
            Trace_mass[j]=(Trace_mass_copy[j]*G)+2*i;
            Vareas_mass[j]=(Vareas_mass_copy[j]*G)+2*i;
       
      }  
    }
    
    source.change.emit();

""")

gain_slider.js_on_change('value', callback)

layout = row(
plot,
column(gain_slider),
)

plot.y_range.flipped = True
show(layout) 

Sorry but your code has too much going on for me to profile and troubleshoot it.
Perhaps you can try keeping arrays rolled into columns and using multi_line instead of line and patches instead of varea.

Okay, I’ll try.
Thank you very much for your help!
The topic is still unresolved. When I solve my problem, I will attach the correct code. In the meantime, I may ask more questions. They will definitely arise)

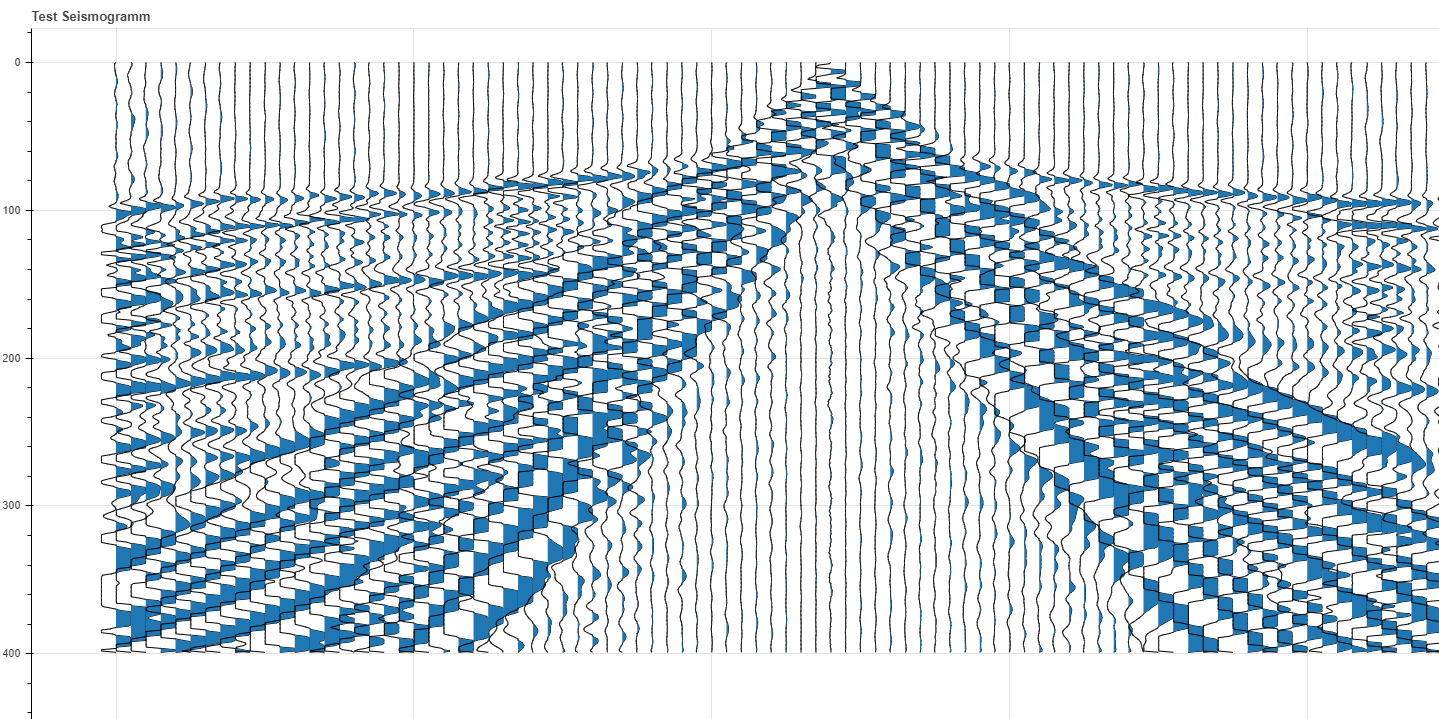
I managed! Added some buttons. Here is the code. Hope this helps someone in the future. Well, on this I think the problem is solved. Thanks to everyone who helped!
Of course, the most pressing question is always relevant. How to do it faster and better?
If someone can help it will be cool.

import math
import numpy as np
from collections import deque
from bokeh.layouts import gridplot,column, row
from bokeh.io import  push_notebook,show,output_notebook
from bokeh.plotting import figure,show,ColumnDataSource
from bokeh.models import CustomJS,Slider, Grid, LinearAxis, MultiLine,Patches,CheckboxButtonGroup
def insert_zeros_in_trace(trace):
    time = np.arange(len(trace))
    zero_idx = np.where(np.diff(np.signbit(trace)))[0]

    time_at_zero = time[zero_idx] - trace[zero_idx] / np.diff(trace)[zero_idx]
    trace_z = np.insert(trace, zero_idx+1, 0)
    time_z = np.insert(time, zero_idx+1, time_at_zero)
    return trace_z, time_z

def add_tags_for_varea(trace,time,level):
    trace_tagged=np.insert(trace, 0, 0)
    trace_tagged=np.insert(trace_tagged, len(trace_tagged), level)
    time_tagged=np.linspace(time[0],time[-1],len(trace_tagged))   
    
    return trace_tagged,time_tagged


def Shifting (tr,delta):
    tr_new = np.zeros(len(tr))
    d = deque(tr)
    d.rotate(int(-delta))
    tr_new = np.array(d)
    return tr_new

step=2
b=-2
w=3
t=np.arange(0,100,0.1)
n=2

W=np.zeros(len(t))
for i in range(len(t)):
    W[i]=(t[i]**n)*math.exp(-b*t[i])*np.sin(w*t[i])
W1=W/W.max()
W_v1=np.where(W>0,W,0)


Vareas_mass=[]
Trace_mass=[]
Time_mass=[]
Num_of_traces=30
for k in range(Num_of_traces):
    Traces=Shifting (W1,k*30)
    Vareas = np.where(Traces>0,Traces,0)
    Traces_step1,Time_step1=insert_zeros_in_trace(Traces)
    Traces_step2,Time_step2=add_tags_for_varea(Traces_step1,Time_step1,0)
    a=np.where(Traces_step2>0,Traces_step2,0)
    
    Trace_mass.append(Traces_step2)
    Vareas_mass.append(a)
    Time_mass.append(Time_step2)    
################################################################################    
source_L = ColumnDataSource(dict(
        xs=[Trace_mass[i]+2*i for i in range(Num_of_traces)],
        ys=[Time_mass[i] for i in range(Num_of_traces)]
        
    )
)
source_copy_L= ColumnDataSource(dict(
        xs=[Trace_mass[i]+2*i for i in range(Num_of_traces)],
        ys=[Time_mass[i] for i in range(Num_of_traces)]
        
    )
)

source_P = ColumnDataSource(dict(
        xs=[Vareas_mass[i]+2*i for i in range(Num_of_traces)],
        ys=[Time_mass[i] for i in range(Num_of_traces)]
    )
)
source_copy_P= ColumnDataSource(dict(
        xs=[Vareas_mass[i]+2*i for i in range(Num_of_traces)],
        ys=[Time_mass[i] for i in range(Num_of_traces)]
    )
)
################################################################################

plot = figure( plot_width=1600, plot_height=800, x_range=(-5, 63))

gain_slider = Slider(start=-99., end=100., value=1., step=0.01, title="Gain",default_size=(300))
checkbox_button_group = CheckboxButtonGroup(labels=["Wiggle", "Clipping"], active=[0, 0])


glyph_L = MultiLine(xs="xs", ys="ys", line_color="#8073ac", line_width=2)
plot.add_glyph(source_L, glyph_L)

glyph_P = Patches(xs="xs", ys="ys", fill_color="#fb9a99",line_alpha=0.1)
plot.add_glyph(source_P, glyph_P)

callback = CustomJS(args=dict(c=step,source_L=source_L,source_copy_L=source_copy_L , source_P=source_P,source_copy_P=source_copy_P,gain=gain_slider,checkbox_button_group=checkbox_button_group),
                    code="""
    var clip = c-0.1;
    var paint = !!checkbox_button_group.active.includes(0);
    console.log(paint)
    var clipping = !!checkbox_button_group.active.includes(1);
    console.log(clipping)
    var data_L = source_L.data;
    var data_copy_L = source_copy_L.data;
    var data_P = source_P.data;
    var data_copy_P = source_copy_P.data;

    var G = gain.value;
    
    for (var i = 0; i <  data_L['xs'].length; i++) {
        var Trace_mass_copy_L = data_copy_L['xs'][i]
        var Vareas_mass_copy_P = data_copy_P['xs'][i]
        var Trace_mass_L = data_L['xs'][i]
        var Vareas_mass_P = data_P['xs'][i]
        
        if (paint && clipping || clipping && paint){
            for (var j = 0; j <  Trace_mass_L.length; j++) {
                Trace_mass_L[j]=((Trace_mass_copy_L[j]-c*i)*G);
                Vareas_mass_P[j]=((Vareas_mass_copy_P[j]-c*i)*G);
                if(Trace_mass_L[j]>=clip){
                    Trace_mass_L[j]=clip;
                }
                else if(Trace_mass_L[j]<-clip){
                    Trace_mass_L[j]=-clip;
                }
                if(Vareas_mass_P[j]>=clip){
                    Vareas_mass_P[j]=clip;
                }
                else if(Vareas_mass_P[j]<-clip){
                    Vareas_mass_P[j]=-clip;
                }
                Trace_mass_L[j]=Trace_mass_L[j]+c*i;
                Vareas_mass_P[j]=Vareas_mass_P[j]+c*i;  
            }

        }
        
        if (paint && !clipping || !clipping && paint){
            for (var j = 0; j <  Trace_mass_L.length; j++) {
                Trace_mass_L[j]=((Trace_mass_copy_L[j]-c*i)*G);
                Vareas_mass_P[j]=((Vareas_mass_copy_P[j]-c*i)*G);
                Trace_mass_L[j]=Trace_mass_L[j]+c*i;
                Vareas_mass_P[j]=Vareas_mass_P[j]+c*i; 
            }        
        }        
        if (!paint && clipping || clipping && !paint){
            for (var j = 0; j <  Trace_mass_L.length; j++){
                Trace_mass_L[j]=((Trace_mass_copy_L[j]-c*i)*G);
                Vareas_mass_P[j] = 0+c*i;
                if(Trace_mass_L[j]>=clip){
                    Trace_mass_L[j]=clip;
                }
                if(Trace_mass_L[j]<-clip){
                    Trace_mass_L[j]=-clip;
                }
                Trace_mass_L[j]=Trace_mass_L[j]+c*i;
            }
                
        }
        if (!paint && !clipping || !clipping && !paint){
            for (var j = 0; j <  Trace_mass_L.length; j++) {
                Trace_mass_L[j]=((Trace_mass_copy_L[j]-c*i)*G);
                Vareas_mass_P[j] = 0+c*i;
                Trace_mass_L[j]=Trace_mass_L[j]+c*i;
        }        
        }     
    }
    source_L.change.emit();
    source_P.change.emit();
""")

checkbox_button_group.js_on_click(callback)
gain_slider.js_on_change('value', callback)


xaxis = LinearAxis()
plot.add_layout(xaxis, 'above')

yaxis = LinearAxis()
plot.add_layout(yaxis, 'right')

plot.add_layout(Grid(dimension=0, ticker=xaxis.ticker))
plot.add_layout(Grid(dimension=1, ticker=yaxis.ticker))

layout = row(
plot,
column(gain_slider, checkbox_button_group),
)
#curdoc().add_root(plot)
plot.y_range.flipped = True
show(layout)

Just a small suggestion - to avoid some of the loops in JavaScript, you can use map: Array.prototype.map() - JavaScript | MDN