Using Python callbacks in Bokeh Dashboard with Flask

Hello there,

we currently try to create a Dashboard using Bokeh graphs. The dashboard should run on a flask server and using bootstrap to get mobile responsiveness. We don’t use the Bokeh layout for this, because it seems that this system is not made for these kind of things. So our problem is with callbacks. We want to stay in python completely and avoid JS for as long as possible.
We created a Flask server which got its graphs from a Bokeh server (no idea if this is the right way). The problem now is that we cannot use bootstrap on the python-version of the site, because we cannot put the plots into divs (they “overflow” the defined divs). The other idea was using JS with embedding and components, but there we would have been using JS callbacks, which we don’t want. So, including the graphs is not a problem, but using python callbacks with the graphs and still using flask and bootstrap seems to be overly complicated. Or am I wrong? I hope, I am. Is there any way, this idea could work?

Any help is appreciated. If you need more info, put it down here.
Greetings,
Tobias
@Freund-Masasana It’s not really possible to say much on that general description. There has been a lot different work on Bokeh layout and embedding over the years so things, for instance, may depend heavily on what versions you are using (which you have not specified).

My suggestion to help others help you would be:

  • Make sure you are using the latest version (currently 1.4)
  • Create a very minimal, complete toy example that shows the kind of thing you are trying to do, and demonstrates the problem

Without being able to run a minimal reproducer to investigate, there is just not much else that can be said, apart from pointing to existing docs, examples, etc. that seem like they might be relevant.

I guess I’d also say it definitely really depends on what kind of page you are trying to create as well. There are certainly some range of responsive layouts that Bokeh works well on, and some that it runs in to issues where it makes more sense to look at templates/embedding. But it boils down to the details.

But to reiterate: the very best most useful thing is a minimal complete reproducer that shows plots overflowing containing divs with Bokeh 1.4 that we can run and investigate directly.

Firstly thank you for the response!

Bokeh version: 1.4.0

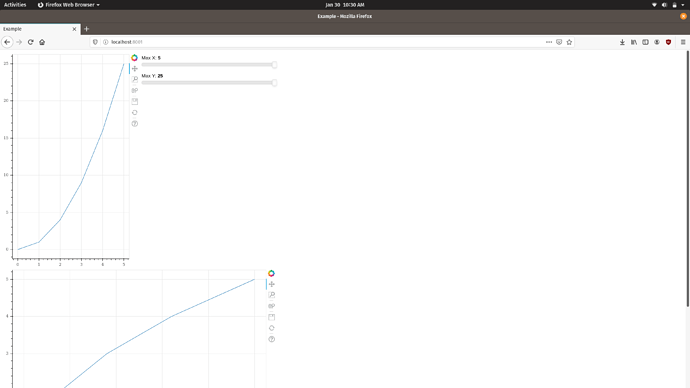
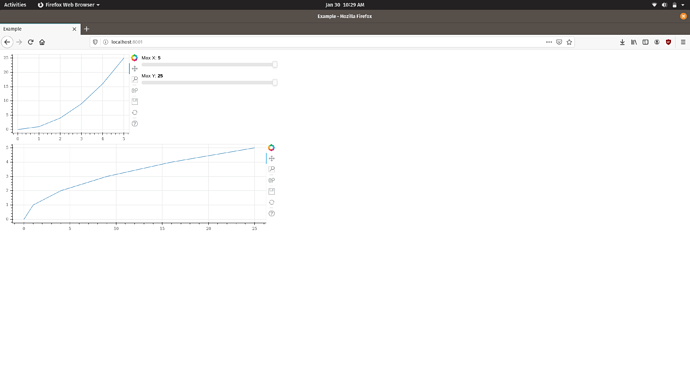
We investigated this further internally and found the problem being a percentage in the css. So “height: 500px” was fine, but “height: 50%” got ignored. I tried to strip this to a minimal example, which got not so minimal, unfortunately…

example.csv:

,x,y
0,0,0
1,1,1
2,2,4
3,3,9
4,4,16
5,5,25

example.html:

<!DOCTYPE html>
<html lang="en">
<head>
    <meta charset="UTF-8">
    <title>Example</title>
</head>
<body>
<div style="height: 500px; width: 40%">
    {{ script|safe }}
</div>

</body>
</html>

example.py:

from bokeh.embed import server_document
from bokeh.layouts import grid, column
from bokeh.models import ColumnDataSource, Slider
from bokeh.plotting import figure
from bokeh.server.server import Server
from flask import Flask, render_template
from tornado.ioloop import IOLoop
from threading import Thread
import pandas as pd

app = Flask(__name__)


@app.route("/", methods=["GET"])
def bkapp_page():
    script = server_document("http://localhost:5007/app")
    return render_template("example.html", script=script)


def bk_worker():
    server = Server({'/app': generate_app},
                    io_loop=IOLoop(),
                    port=5007,
                    allow_websocket_origin=["localhost:8001"])
    server.start()
    server.io_loop.start()


def generate_app(doc):
    df = pd.read_csv("example.csv", index_col=0)
    data_source = ColumnDataSource(df)
    line_plot1 = figure(sizing_mode="stretch_both")
    line_plot1.line(
        source=data_source,
        x="x",
        y="y",
    )
    line_plot2 = figure(sizing_mode="stretch_both")
    line_plot2.line(
        source=data_source,
        x="y",
        y="x",
    )
    sliders = [
        Slider(start=0, end=5, value=5, step=1, title="Max X"),
        Slider(start=0, end=25, value=25, step=1, title="Max Y"),
    ]

    def update_graph(attr, old, new):
        x_max = sliders[0].value
        y_max = sliders[1].value
        filtered_df = df[(df["x"] <= x_max) & (df["y"] <= y_max)]
        new_data = ColumnDataSource(filtered_df).data
        data_source.data = new_data

    for slider in sliders:
        slider.on_change("value", update_graph)

    layout = grid(
        [
            [
                line_plot1,
                column(sliders),
            ],
            line_plot2,
        ],
        sizing_mode="stretch_both",
    )

    doc.add_root(layout)


if __name__ == '__main__':
    Thread(target=bk_worker).start()
    app.run(port=8001)

result:

If we change the value of “height” in example.html to “height: 50%”, the result looks like this:

Yesterday I literally saw the overflow in the Firefox inspector. So I am trying to reproduce this again. But in this example above, there is only the percentage thing. Will update you soon.

Greetings,
Tobias