Variable Width for Jitter in Bokeh Scatter Plot

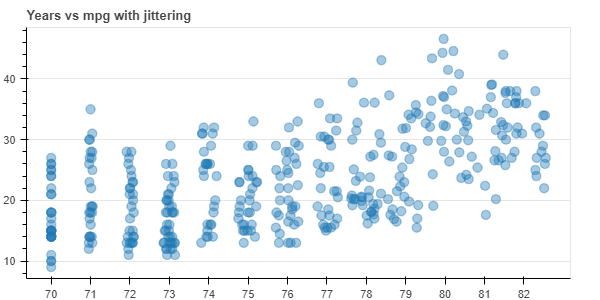
I am currently working on a project using Bokeh for data visualization in Python. I have a scatter plot where I am using the jitter function to add some randomness to the x-coordinates of my points. Here is a simplified version of my current code:

from bokeh.models import ColumnDataSource
from bokeh.plotting import figure
from bokeh.transform import jitter

# Assuming you have a DataFrame df with columns 'x' and 'y'
df = pd.DataFrame({
    'x': [1, 2, 3, 4, 5],
    'y': [2, 5, 8, 2, 7]
})
source = ColumnDataSource(df)

# Create a new plot
p = figure()

# Add a scatter plot with jitter on the x-axis
p.scatter(
    x=jitter('x', width=0.2 range=p.x_range),
    y='y',
    source=source,
    size=5,
    color='blue',
    line_color='#000000',
    line_alpha=0.6,
    alpha=0.6,
)

However, I would like to have a variable width for the jitter, meaning that the amount of jitter would be different for each point, based on another column in my DataFrame. For example, if I have a column ā€˜jitter_widthā€™ in my DataFrame, I would like to use its values as the width for the jitter.

...
df['jitter_width'] = df['value'] / max(df['value']) * 0.2
...
x=jitter('x', width='jitter_width' range=p.x_range),
...

Unfortunately, it seems that the jitter function in Bokeh does not currently support variable widths. The width parameter is a fixed value that applies to all points. Does anyone know of a workaround or an alternative way to achieve this in Bokeh? Any help would be greatly appreciated.

jitter only currently supports drawing point offsets from a single uniform or normal distribution that applies to all points. There is not currently and way to change the distribution on a per-point basis. Some options:

  • pre-compute the jittered points in Python and plot those directly from your CDS
  • pre-compute the jittered offsets in Python use a CustomJSTransform to apply the offsets stored in a CDS
  • Use a CustomJSTransform to compute the offsets in JavaScript

This question prompted some intellectual curiosity from me so I came up with a pretty straightforward CustomJSTransform solution that leverages the already built for us jitter transform. Basically you create a jitter transform python side and pass it into the CustomJSTransform and use it to compute the jitter for each jitter width ā€œgroupā€:

from bokeh.plotting import figure, show, save
from bokeh.sampledata.autompg import autompg
from bokeh.transform import jitter, transform
from bokeh.models import CustomJSTransform, ColumnDataSource


jitter_dict = {x:i*0.1 for i,x in enumerate(autompg['yr'].unique())} #maps the x category to a desired width
years = sorted(autompg.yr.unique())

source = ColumnDataSource(autompg)

# Create a new plot
p = figure()

p2 = figure(width=600, height=300, title="Years vs mpg with jittering")
p2.xgrid.grid_line_color = None
p2.xaxis.ticker = years

#make a "dummy" jitter transform python side (only using it to get the transform)
j = jitter('yr',0)
#pass the source, the jitter transform instance, and the jitter_dict (really a map) into a CustomJSTransform
tr = CustomJSTransform(args=dict(source=source,j=j.transform,jitter_dict=jitter_dict)
                       , v_func='''
                       var result = Array(source.data['yr'].length) //populate an array = to the length of the source
                       
                       //going through each jitter dict entry...
                       for (const [k,v] of jitter_dict.entries()){
                               //retrieve the indices in the datasource corresponding to that entry
                               var inds = source.data['yr'].reduce((acc, x, index) => acc.concat(x == k ? index : []), []);
                               //"use" the jitter transform to compute the x values for those indices
                               //this one jitter transform instance basically gets "reused" each time through the loop
                               j.mean = k
                               j.width = v
                               var xv = j._v_compute(inds.length) //this 
                               //set the result array at those indices 
                               inds.map((x,i)=>result[x]=xv[i])
                               }                       
                       return result
                       '''
                       )
p2.scatter(x=transform(field_name='yr',transform=tr), y='mpg', size=9, alpha=0.4, source=autompg)

save(p2,'jitter_test.html')

image

2 Likes

@gmerritt123 thatā€™s really neat!

FWIW I interpreted the ask to be more like this discussion, e.g. a different distribution based on the height

Add DodgedScatter glyph Ā· bokeh/bokeh Ā· Discussion #11382 Ā· GitHub

I still think that is doable and probably in a very similar way to your example

1 Like

Yeah the way to do that would be to do the same thing but instead use the jitter transform to compute a ā€œbaseā€ jitter, then scale each points actual jitter off that by some function. in @Lou 's case, itā€™d be basically a function of percentile ā†’ so the highest mpg would get maximum jitter.

With a little CustomJS trickery (explicitly telling the CustomJSTransform to re-compute on slider value change), you can even make the ā€œjitter height factorā€ interactive (I added a colormap for illustration):

from bokeh.plotting import figure, show, save
from bokeh.sampledata.autompg import autompg
from bokeh.transform import jitter, transform, linear_cmap
from bokeh.palettes import Turbo256
from bokeh.models import CustomJSTransform, ColumnDataSource, Slider, CustomJS
from bokeh.layouts import column

# Assuming you have a DataFrame df with columns 'x' and 'y'

jitter_dict = {x:i*0.1 for i,x in enumerate(autompg['yr'].unique())} #maps the x category to a desired width
years = sorted(autompg.yr.unique())

source = ColumnDataSource(autompg)

# Create a new plot
p = figure()

p2 = figure(width=1200, height=600, title="Years vs mpg with jittering")
p2.xgrid.grid_line_color = None
p2.xaxis.ticker = years


sl = Slider(start=0,end=1,step=0.1,value=0,title='jitter height factor')

#make a "dummy" jitter transform python side (only using it to get the transform)
j = jitter('yr',0)
#pass the source, the jitter transform instance, and the jitter_dict (really a map) into a CustomJSTransform
tr = CustomJSTransform(args=dict(source=source,j=j.transform,jitter_dict=jitter_dict,sl=sl)
                       , v_func='''
                       j.mean = 0
                       j.width = 1
                       var xv = j._v_compute(source.data['yr'].length) //creates a "base" jitter
                       var result = []
                       var max_v = Math.max(...source.data['mpg']) //get max AND min y values
                       var min_v = Math.min(...source.data['mpg'])
                       for (var i = 0; i<xv.length; i++){
                               var x = source.data['yr'][i] //base X
                               var y = source.data['mpg'][i] //current y
                               //scales the amount of jitter for this point by the "jitter height factor" (sl.value) and its percentile 
                               var wf = (y-min_v)/(max_v-min_v) *sl.value* xv[i] + x 
                               result.push(wf)
                               }
                       
                       return result
                       '''
                       )


r = p2.scatter(x=transform(field_name='yr',transform=tr), y='mpg', size=9, alpha=0.4, fill_color=linear_cmap(field_name='mpg',palette=Turbo256,low=0,high=50)
               , source=autompg)


sl.js_on_change('value',CustomJS(args=dict(source=source,tr=tr)
                                 ,code='''
                                 tr.change.emit()
                                 source.change.emit()
                                 '''))

save(column([p2,sl]),'jitter_test.html')

jitta

1 Like

Thank you so much for your detailed explanation! Itā€™s exactly what I was looking for. The way you suggested using the jitter transform and customizing it based on percentile is brilliant. And the code example you provided looks fantastic, especially with the added colormap for illustration. I really appreciate your help with this, itā€™s going to be incredibly useful for my project.

2 Likes