Hi there
I have the following plot
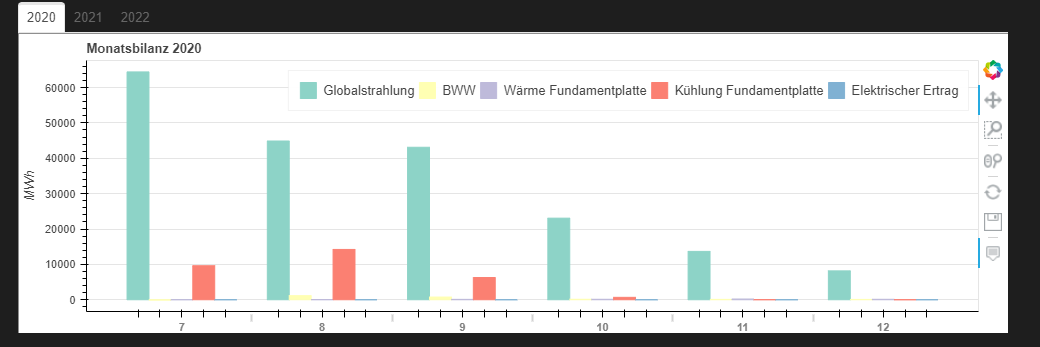
generated by the following code
    months = [str(m) for m in data.index.month]
    xs = [(m, c) for m in months for c in pvt_categories]
    tops = [
        data.loc[d, c]
        for d in data.index
        for c in pvt_categories
    ]

    colors = [c for _ in months for c in Set3[len(pvt_categories)]]

    plot = svg_figure_with_save_tool(
        x_range=FactorRange(*xs),
        plot_height=plot_h,
        width=plot_w,
        title=f"Monatsbilanz {year}",
        toolbar_location="right",
        tools="pan,wheel_zoom,box_zoom,reset",
        y_axis_label="MWh",
    )

    source = dict(x=xs, top=tops, legend=[l for _, l in xs], color=colors)

    plot.vbar(x="x", top="top", legend_field="legend", color="color", source=ColumnDataSource(source))
Now, I’d like to stack the BWW and the Wärme Fundamentalplatte columns but leave the other columns unstacked. Is that possible? How would I go about this?
Thanks a lot!
Cheers,
Damian