If I understand correctly, you want to be able to preserve data other that number of sales so you can show them in your hover tool. I’m not sure if that’s possible with vbar_stack but I think you can do it by calculating the y coordinates and just use vbar. Let me know if I’m misunderstanding your question but here is how I would implement what I described above:
import pandas as pd
from bokeh.io import output_notebook, show
from bokeh.plotting import figure
from bokeh.models import ColumnDataSource
from bokeh.palettes import Category10_10
from bokeh.models import HoverTool
output_notebook()
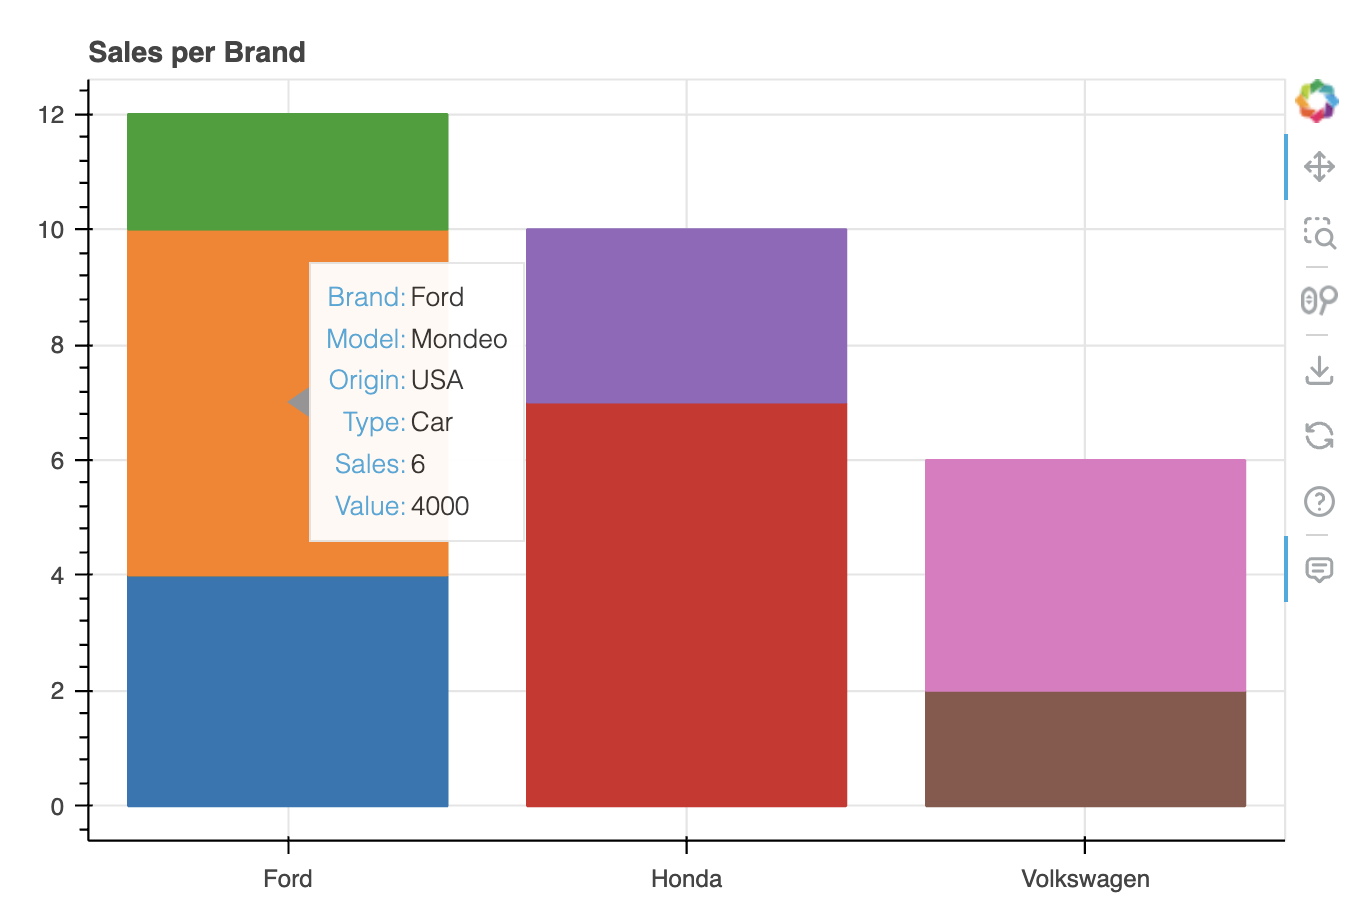
sales = pd.DataFrame.from_records(
[{'Brand': 'Ford', 'Origin': 'USA', 'Model': 'Mustang', 'Type': 'Car', 'Sales': 4, 'Value': 10000},
{'Brand': 'Ford', 'Origin': 'USA', 'Model': 'Mondeo', 'Type': 'Car', 'Sales': 6, 'Value': 4000},
{'Brand': 'Ford', 'Origin': 'USA', 'Model': 'Transit', 'Type': 'Van', 'Sales': 2, 'Value': 3000},
{'Brand': 'Honda', 'Origin': 'Japan', 'Model': 'Accord', 'Type': 'Car', 'Sales': 7, 'Value': 3500},
{'Brand': 'Honda', 'Origin': 'Japan', 'Model': 'Civic', 'Type': 'Car', 'Sales': 3, 'Value': 1500},
{'Brand': 'Volkswagen', 'Origin': 'Germany', 'Model': 'Beetle', 'Type': 'Car', 'Sales': 2, 'Value': 2000},
{'Brand': 'Volkswagen', 'Origin': 'Germany', 'Model': 'Passat', 'Type': 'Car', 'Sales': 4, 'Value': 2800}
]
)
sales['high'] = sales.groupby('Brand')['Sales'].cumsum()
sales['low'] = sales['high'] - sales['Sales']
sales['color'] = [Category10_10[x] for x in sales.index]
source = ColumnDataSource(data=sales)
p = figure(
title="Sales per Brand",
x_range=sales['Brand'].unique(), height=400
)
p.vbar(x='Brand', bottom='low', top='high', width=0.8, color='color', source=source)
h = HoverTool(
tooltips=[
('Brand', '@Brand'),
('Model', '@Model'),
('Origin', '@Origin'),
('Type', '@Type'),
('Sales', '@Sales'),
('Value', '@Value'),
],
)
p.add_tools(h)
show(p)