Hi guys,
I plotted the figure with some vbars. The x-axis is based on a list, let us say: [71, 72].
If I like to display just these two numbers, how could I do?
Currently, my result is as the screenshot shown below.
welcome any hints.
Thanks a lot.
Hi guys,
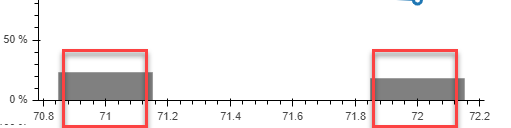
I plotted the figure with some vbars. The x-axis is based on a list, let us say: [71, 72].
If I like to display just these two numbers, how could I do?
Currently, my result is as the screenshot shown below.
welcome any hints.
Thanks a lot.
This should help:
import numpy as np
from bokeh.plotting import figure, show
x = np.linspace(0, 10, 1000)
plot = figure()
plot.line(x = x, y = np.log(x) * np.sin(x))
plot.xaxis[0].ticker.desired_num_ticks = 2
show(plot)
``
On Tuesday, January 8, 2019 at 12:50:28 AM UTC+1, peng wang wrote:
Hi guys,
I plotted the figure with some vbars. The x-axis is based on a list, let us say: [71, 72].
If I like to display just these two numbers, how could I do?
Currently, my result is as the screenshot shown below.
welcome any hints.
Thanks a lot.
