Hello everyone!
I am trying to plot a huge amount of data. We are talking about a million lines with a thousand samples each. that is, shape = (10e6,10e3).
Obviously, you can’t put it into one plot right away. But the important point is that this is a very elongated drawing. Like a ribbon.
I had an idea. Having loaded ALL data when drawing, display only, for example, 100 lines and then, when interacting with the slider, dynamically draw another 100 lines. That is, in fact, move in a certain window as in the diagram below
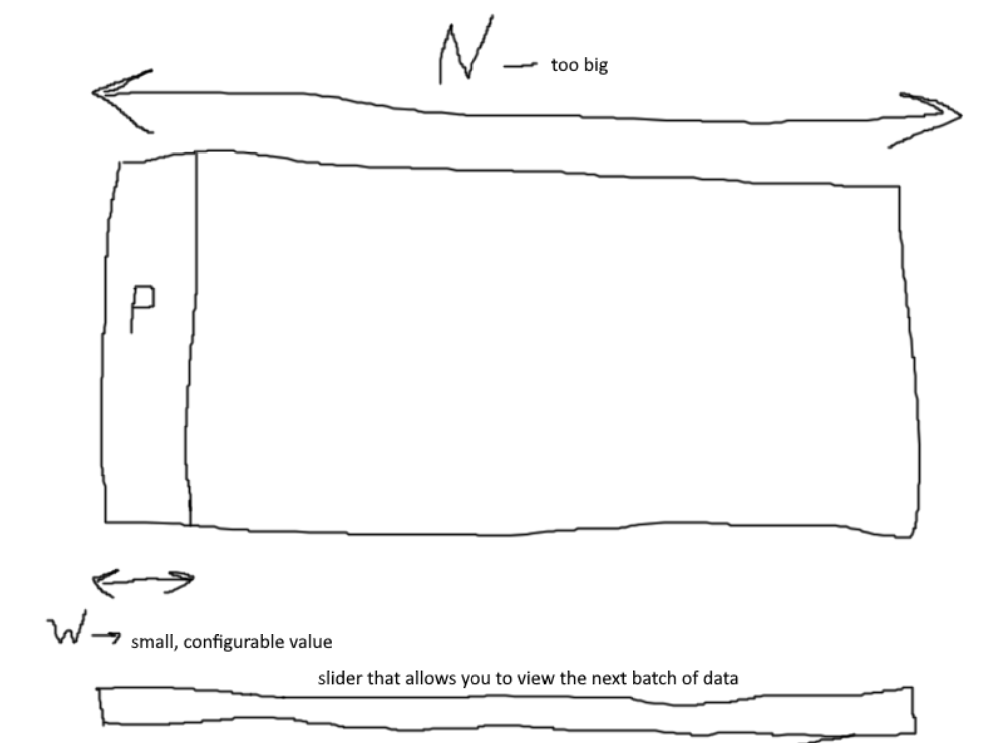
Please also note that this plot will support interactive, that is. But I am not giving this in example below.
The question is how to actually do this. Dynamically draw data in a window.
Below is an example of the code on a number of random lines.
import numpy as np
from bokeh.io import  push_notebook,show,output_notebook
from bokeh.layouts import gridplot
from bokeh.plotting import figure,show,ColumnDataSource
from bokeh.models import MultiLine, Grid, LinearAxis
N=100
Traces=np.random.rand(N,1000)

length=np.arange(0,len(Traces[0]))
step = 5
Num_of_traces = len(Traces)
clip = step-0.1

#The code is strange here because a piece of additional operations was cut
Trace_mass=[]
Time_mass=[]
for k in range(Num_of_traces):
    Trace_mass.append(Traces[k])
    Time_mass.append(np.arange(1000))

###############################################################################
source_L = ColumnDataSource(dict(
        xs=[Traces[i]+step*i for i in range(Num_of_traces)],
        ys=[Time_mass[i] for i in range(Num_of_traces)]

    )
)
###############################################################################

output_notebook()
plot = figure( title='example',plot_width=1600, plot_height=800, x_range=(0-5, N*step+5))

glyph_L = MultiLine(xs="xs", ys="ys", line_color="#8073ac", line_width=2)
L=plot.add_glyph(source_L, glyph_L)


point_attributes = ['x','y']

xaxis = LinearAxis()
plot.add_layout(xaxis, 'above')

yaxis = LinearAxis()
plot.add_layout(yaxis, 'right')

plot.add_layout(Grid(dimension=0, ticker=xaxis.ticker))
plot.add_layout(Grid(dimension=1, ticker=yaxis.ticker))

plot.y_range.flipped = True

show(plot)