Anyone know of examples for text annotation visualization?
Here is an example from here: http://nlp.cogcomp.org/
Basically, the goal is to create such graphs (text, some spans, and their edges), for a given text and its annotation on the fly.
If you have something like this, better to make it more explicit and highlight it, since this would bring so attention from AI and Natural Language Processing community to your library.
Offhand I would say that this is a fairly specialized kind of plot. I do think you could make a bokeh app or plot that did most of this, but I do not think it would be trivial. However it's worth nothing that at present Bokeh does not support directed graphs, or arrows with "curved" tails, so that might be a showstopper for the time being. In any case, since the actual size of text labels is really only available in the client/browser, and not in python, to really make a completely general solution that lay things out automatically with enough space between, etc. would requite making a custom extension that could access the text sizes. Essentially, this kind of thing seems like a nice candidate for a separate project built on top of Bokeh that caters to the specialized use-cases of the NLP community. If you are interested in embarking on that kind of work, I am happy to provide more guidance and information.
Anyone know of examples for text annotation visualization?
Here is an example from here: http://nlp.cogcomp.org/
Basically, the goal is to create such graphs (text, some spans, and their edges), for a given text and its annotation on the fly.
If you have something like this, better to make it more explicit and highlight it, since this would bring so attention from AI and Natural Language Processing community to your library.
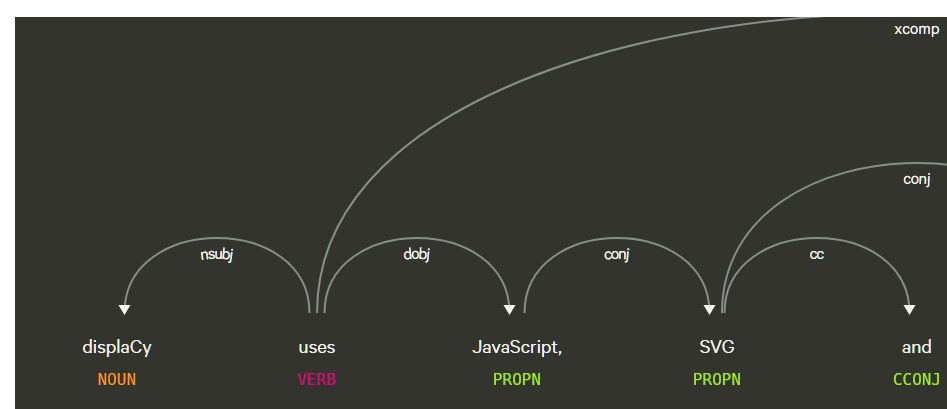
I would look at spacy - They have displacy. - opensource
As of v2.0, our popular visualizers, displaCy and displaCy ENT are finally an official part of the library. Visualizing a dependency parse or named entities in a text is not only a fun NLP demo – it can also be incredibly helpful in speeding up development and debugging your code and training process. If you’re running a Jupyter notebook, displaCy will detect this and return the markup in a format ready to be rendered and exported.
On Sun, Apr 29, 2018 at 12:59 PM, Bryan Van de ven [email protected] wrote:
Hi,
Offhand I would say that this is a fairly specialized kind of plot. I do think you could make a bokeh app or plot that did most of this, but I do not think it would be trivial. However it’s worth nothing that at present Bokeh does not support directed graphs, or arrows with “curved” tails, so that might be a showstopper for the time being. In any case, since the actual size of text labels is really only available in the client/browser, and not in python, to really make a completely general solution that lay things out automatically with enough space between, etc. would requite making a custom extension that could access the text sizes. Essentially, this kind of thing seems like a nice candidate for a separate project built on top of Bokeh that caters to the specialized use-cases of the NLP community. If you are interested in embarking on that kind of work, I am happy to provide more guidance and information.
Basically, the goal is to create such graphs (text, some spans, and their edges), for a given text and its annotation on the fly.
If you have something like this, better to make it more explicit and highlight it, since this would bring so attention from AI and Natural Language Processing community to your library.
Daniel
–
You received this message because you are subscribed to the Google Groups “Bokeh Discussion - Public” group.
To unsubscribe from this group and stop receiving emails from it, send an email to [email protected].