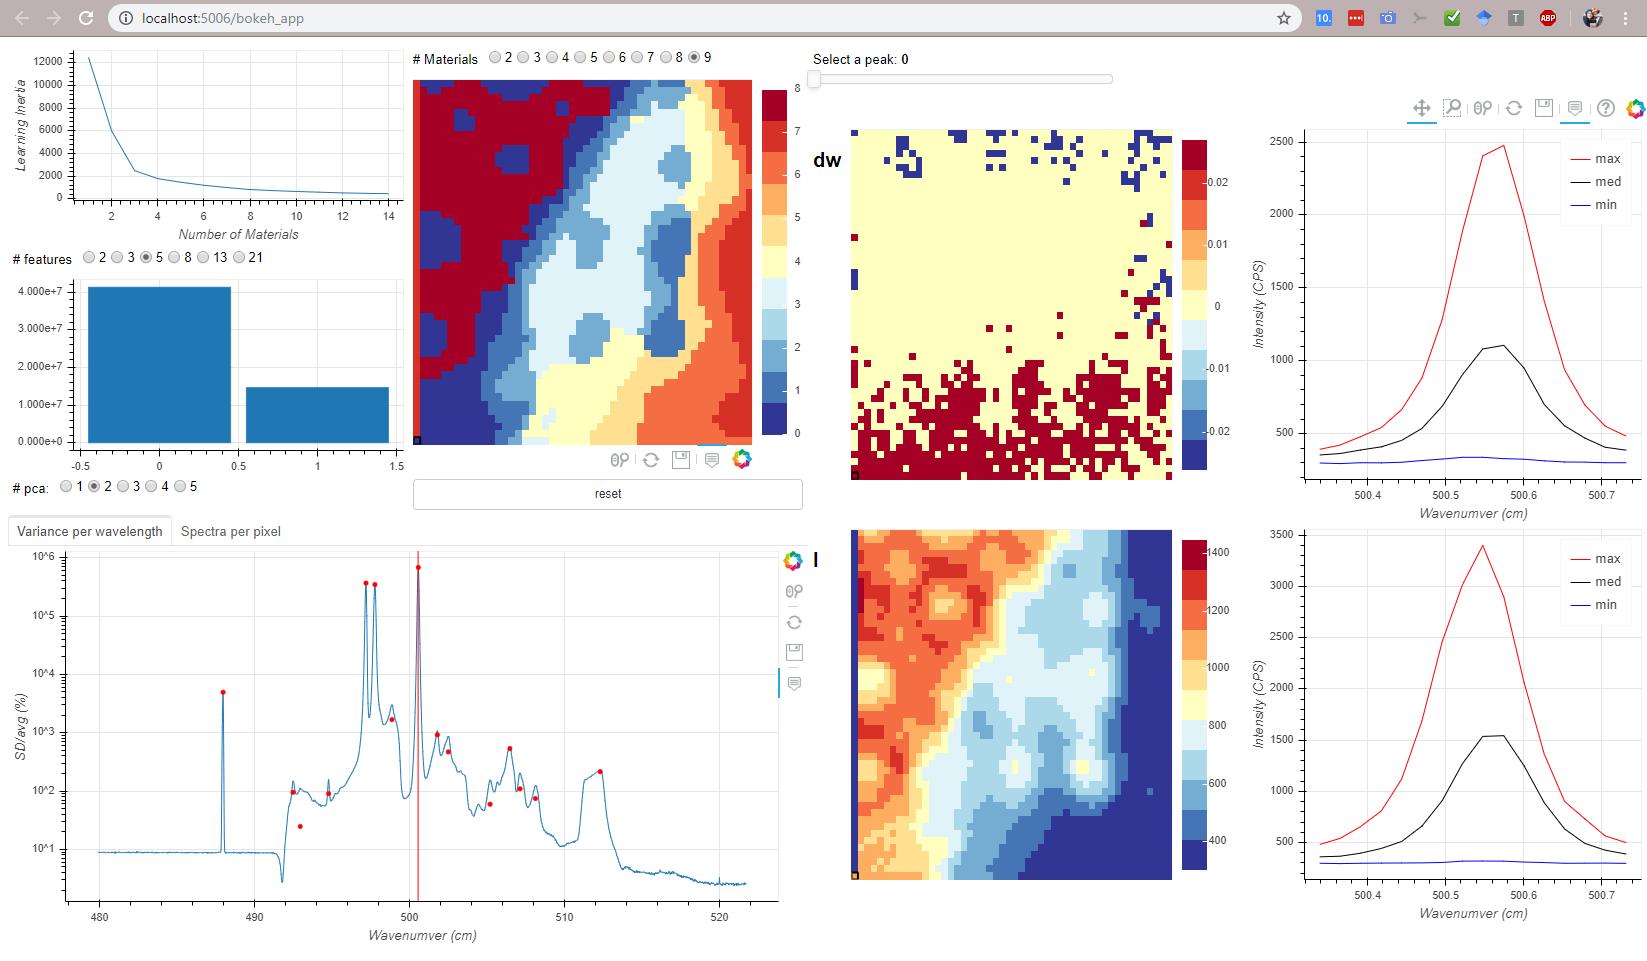
In my work we produce 3D arrays of data (2D maps of spectra). To visualize the data I created a map class to prepare data for plotting with bokeh library. A map object is created by:
rm = RamanMap()
The map class slices the 3D array into multiple 2D maps. A bokeh Slider is used to switch between the maps/slices:
slider = Slider(start=0,
                end=rm.n_peaks-1,   # the number of slices
                value=0, step=1,
                title='Select a peak')
slider.on_change('value', peakSelector)
as well as to highlight the maps(slice) position on a full spectrum position using a Span:
span = Span(location=spectra_src.data['x'].mean(),
            dimension='height',
            line_color='red',
            line_width=1)
The slider callback function is defined as follows:
def peakSelector(attr, old, new):
    n = slider.value
    rm.sliceMap(n)   # choose a different slice using a map method
    spectra_src.data = rm.sliced_spectra   # one kind of map
    maps_src.data = rm.sliced_maps   # another kind of map
    span.location = spectra_src.data['x'].mean()
    g_mapper.low  = maps_src.data['g_max'][0].min()
    g_mapper.high = maps_src.data['g_max'][0].max()
    int_mapper.low = maps_src.data['intensities'][0].min()
    int_mapper.high = maps_src.data['intensities'][0].max()
g_mapper and int_mapper are LinearColorMapper objects, their upper and lower values need to be changed with the selected map.
The maps are created using a function that returns image and mapper with the following code:
image = figure(...)
image.image(image=image_name ,source = source, ......)
mapper_low  = source.data[image_name][0].min()
mapper_high = source.data[image_name][0].max()
mapper = LinearColorMapper(.... low=mapper_low, high=mapper_high)
color_bar = ColorBar(color_mapper=mapper, location=(0,0))
image.add_layout(color_bar, 'right')
image.js_on_event(
    events.Tap,
    update_input_multi(user_input, spectra_visible_multi, spectra_available_multi)
)
image.rect('x', 'y', 1, 1, source=user_input, fill_color=None, line_width=2, line_color='black')
The last two lines image.rect and image.js_on_event() link several ColumnDataSources allowing one click on any of three shown maps to affect all other maps, adding a new rect to highlight the selected pixel, and to show the spectrum from the highlighted pixel on another figure.
Watch the video to understand how this works:

The CustomJS function takes the index of the tapped pixel and and uses it to
- Draw a new rectangle on all maps, since they share the same input,
- add a spectrum from
availabletovisibleColumnDataSources
def update_input_multi(user_source, visible, available):
    return CustomJS(
        args=dict(user_source=user_source, visible=visible, available=available),
        code ='''
        var data = user_source.data;
        var spectra = visible.data;
        var all_spectra = available.data;
        //var x = parseInt(cb_obj['x']); //updated according to reply by Bryan
        //var y = parseInt(cb_obj['y']);
        const x = parseInt(cb_obj.x);
        const y = parseInt(cb_obj.y);
      //avoid input from tapping outside the edges
        if((x >= 0) && (y >= 0) && (x < 50) && (y < 50)) {
            const z = (x+1)+(y*50);
            // check if the only available data is (0,0) then replace it with the first data point the user clicks
            if((data['x'].length == 1) && (data['x'] == 0.5) && (data['y'] == 0.5)) {
                // if this is the first tap
                data['x'] = [x+0.5];
                data['y'] = [y+0.5];
                //data values are shifted 0.5 to center rectangles on index
                spectra['ys'] = [all_spectra['ys'][z-1]];
                visible.change.emit();
                user_source.change.emit();
            }  else  {
                data['x'].push(x+0.5);
                data['y'].push(y+0.5);
                var wave = spectra['waves']['0'];
                spectra['ys'].push(all_spectra['ys'][z-1]);
                spectra['waves'].push(wave);
                visible.change.emit();
                user_source.change.emit();
            }
        }
    ''')
Notice that I had to add 0.5 to the indices of the rectangles since I didn’t know how to draw rectangles from theirs centers.
I still do not know how to plot the selected spectra in multiple colors. It will be a subject of a future update.