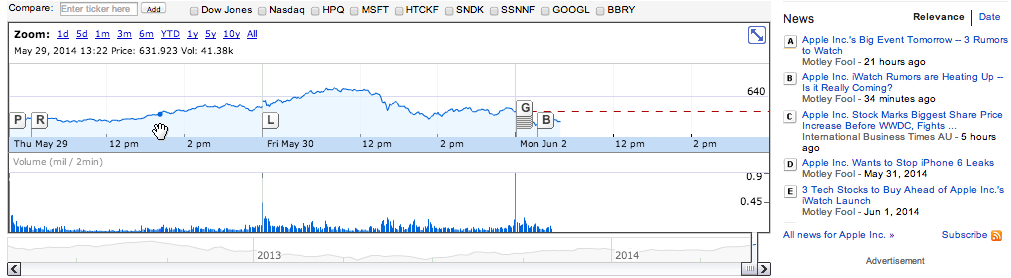
Google Finance has a nice interactive visualization framework that allows users to see the evolution of stock prices on a chart for a given financial symbol along with a series of tickers on the X-axis. The tickers correspond to items int the “News feed” on the right.
The framework is a nice way to see how specific events in the news could have affected the evolution of stock price.
Can Bokeh currently be used to build this type of visualization? If so, what building blocks would be needed for this?
Thanks!
Josh
Josh,
Thanks for your interest in using Bokeh. In what context would you like to build such a visualization? What development skillsets do you have (this helps me understand how you would be most comfortable customizing Bokeh)?
Bokeh can’t completely do a google finance style plot right now. But we do have plans to be able to implement such functionality. Talking about the building blocks is a helpful excrecise.
The main plot would be a plot called P1.
There would also be a plot P2 for the volume.
Below that there would be another plot for the time window, called P3. This plot would plot on the same datasource, with the same x and y columns, P1 and P3 would have a different datarange object (data ranges control the mapping of data coordinates to screen coordinates) The x range of P1 in the displayed view is a smaller time window then the x range of P3. P1 and P2 would share the same x data range, but have different y-data ranges.
P3 plot would have a special time-window zoom tool (I just made time-window-zoom up, name subject to change). The time window zoom would operate on the datarange of P1 and P2.
···
P1 would have an additional renderer of type “callout” (callout is a new type of renderer, again subject to change). There will be a mechanism for registering callbacks from on-click on callout to external js.
The news panel of the right probably wouldn’t be a bokeh primitive. I would recommend writing that in a frontend JS framework such as angular. The news panel would listen to the callout renderer’s onclick to show the right news piece on the screen.
The pieces that bokeh currently lacks that would make such a chart possible are
-
time-window-zoom tool. If you are willing to forgo the exact mechanics of google’s implementation, this could probably be accomplished with a box-zoom type tool that displays on P3 but operates on P1/P2’s x-data range
-
Better integration for callbacks with external js frameworks. We are still working out the mechanics of how to provide good js level callback hooks.
-
I’m fairly sure that Peter and Bryan would say that a layout system (cassowary) is necessary to position plots P1, P2, P3.
-
Its possible that we could build the news list as a bokeh widget, but I think it would be awkward. Maybe we could provide a default implemenation for such a linked table, but make it easy for users to extend external to bokeh. I want people to be able to customize bokeh without having to run the bokeh build process. Users should be able to create bokeh widgets with just js, without modifying bokeh.js
I hope this helps Josh. I’m sure Peter, Bryan or Hugo will chime in with additional information.
Thanks,
Paddy
On Mon, Jun 2, 2014 at 10:46 AM, Josh Wasserstein [email protected] wrote:
Google Finance has a nice interactive visualization framework that allows users to see the evolution of stock prices on a chart for a given financial symbol along with a series of tickers on the X-axis. The tickers correspond to items int the “News feed” on the right.
The framework is a nice way to see how specific events in the news could have affected the evolution of stock price.
Can Bokeh currently be used to build this type of visualization? If so, what building blocks would be needed for this?
Thanks!
Josh
–
You received this message because you are subscribed to the Google Groups “Bokeh Discussion - Public” group.
To unsubscribe from this group and stop receiving emails from it, send an email to [email protected].
To post to this group, send email to [email protected].
To view this discussion on the web visit https://groups.google.com/a/continuum.io/d/msgid/bokeh/CAD4ivxWojOd61LpE7tRNeCgb-7c4JAX_%2B%2Bw_175fwoGtVPcNAg%40mail.gmail.com.
For more options, visit https://groups.google.com/a/continuum.io/d/optout.
Thank you Paddy. This is extremely helpful. Thanks for the pointers to angular and cassowary and for the general tips on how to potentially organize the layout and callbacks.
I second the comment: “Users should be able to create bokeh widgets with just js, without modifying bokeh.js”.
Ignoring the plots P2 and P3 for a moment, how would you go around building a simpler version of it with the current (or near-future) release of Bokeh?
By simpler I mean just time chart with clickable x markers that can be used to select/highlight items from a news (events) feed (e.g. perhaps a table), and with support for reverse look-up, i.e. users click on an item on the news feed, and the plot centers the x axis around the time of the event.
This would be very valuable for general time-series visualization.
Josh
···
On Mon, Jun 2, 2014 at 11:06 AM, Paddy Mullen [email protected] wrote:
Josh,
Thanks for your interest in using Bokeh. In what context would you like to build such a visualization? What development skillsets do you have (this helps me understand how you would be most comfortable customizing Bokeh)?
Bokeh can’t completely do a google finance style plot right now. But we do have plans to be able to implement such functionality. Talking about the building blocks is a helpful excrecise.
The main plot would be a plot called P1.
There would also be a plot P2 for the volume.
Below that there would be another plot for the time window, called P3. This plot would plot on the same datasource, with the same x and y columns, P1 and P3 would have a different datarange object (data ranges control the mapping of data coordinates to screen coordinates) The x range of P1 in the displayed view is a smaller time window then the x range of P3. P1 and P2 would share the same x data range, but have different y-data ranges.
P3 plot would have a special time-window zoom tool (I just made time-window-zoom up, name subject to change). The time window zoom would operate on the datarange of P1 and P2.
–
You received this message because you are subscribed to the Google Groups “Bokeh Discussion - Public” group.
To unsubscribe from this group and stop receiving emails from it, send an email to [email protected].
To post to this group, send email to [email protected].
To view this discussion on the web visit https://groups.google.com/a/continuum.io/d/msgid/bokeh/CAFpY3ucOYV1PVQjN6b%2BDfgfrjPGCUx3AxwWLNRL6tMFCTy4veQ%40mail.gmail.com.
For more options, visit https://groups.google.com/a/continuum.io/d/optout.
P1 would have an additional renderer of type “callout” (callout is a new type of renderer, again subject to change). There will be a mechanism for registering callbacks from on-click on callout to external js.
The news panel of the right probably wouldn’t be a bokeh primitive. I would recommend writing that in a frontend JS framework such as angular. The news panel would listen to the callout renderer’s onclick to show the right news piece on the screen.
The pieces that bokeh currently lacks that would make such a chart possible are
-
time-window-zoom tool. If you are willing to forgo the exact mechanics of google’s implementation, this could probably be accomplished with a box-zoom type tool that displays on P3 but operates on P1/P2’s x-data range
-
Better integration for callbacks with external js frameworks. We are still working out the mechanics of how to provide good js level callback hooks.
-
I’m fairly sure that Peter and Bryan would say that a layout system (cassowary) is necessary to position plots P1, P2, P3.
-
Its possible that we could build the news list as a bokeh widget, but I think it would be awkward. Maybe we could provide a default implemenation for such a linked table, but make it easy for users to extend external to bokeh. I want people to be able to customize bokeh without having to run the bokeh build process. Users should be able to create bokeh widgets with just js, without modifying bokeh.js
I hope this helps Josh. I’m sure Peter, Bryan or Hugo will chime in with additional information.
Thanks,
Paddy
On Mon, Jun 2, 2014 at 10:46 AM, Josh Wasserstein [email protected] wrote:
Google Finance has a nice interactive visualization framework that allows users to see the evolution of stock prices on a chart for a given financial symbol along with a series of tickers on the X-axis. The tickers correspond to items int the “News feed” on the right.
The framework is a nice way to see how specific events in the news could have affected the evolution of stock price.
Can Bokeh currently be used to build this type of visualization? If so, what building blocks would be needed for this?
Thanks!
Josh
–
You received this message because you are subscribed to the Google Groups “Bokeh Discussion - Public” group.
To unsubscribe from this group and stop receiving emails from it, send an email to [email protected].
To post to this group, send email to [email protected].
To view this discussion on the web visit https://groups.google.com/a/continuum.io/d/msgid/bokeh/CAD4ivxWojOd61LpE7tRNeCgb-7c4JAX_%2B%2Bw_175fwoGtVPcNAg%40mail.gmail.com.
For more options, visit https://groups.google.com/a/continuum.io/d/optout.
Thanks Paddy for the excellent exposition,it covered a question about linked axes in Bokeh I wished to ask.
Would It be possible currently to link P1 and P2 by axis easily?That would be a sufficient implementation for my use case.
Best
Adain
···
On Monday, June 2, 2014 4:06:19 PM UTC+1, Paddy Mullen wrote:
Josh,
Thanks for your interest in using Bokeh. In what context would you like to build such a visualization? What development skillsets do you have (this helps me understand how you would be most comfortable customizing Bokeh)?
Bokeh can’t completely do a google finance style plot right now. But we do have plans to be able to implement such functionality. Talking about the building blocks is a helpful excrecise.
The main plot would be a plot called P1.
There would also be a plot P2 for the volume.
Below that there would be another plot for the time window, called P3. This plot would plot on the same datasource, with the same x and y columns, P1 and P3 would have a different datarange object (data ranges control the mapping of data coordinates to screen coordinates) The x range of P1 in the displayed view is a smaller time window then the x range of P3. P1 and P2 would share the same x data range, but have different y-data ranges.
P3 plot would have a special time-window zoom tool (I just made time-window-zoom up, name subject to change). The time window zoom would operate on the datarange of P1 and P2.
P1 would have an additional renderer of type “callout” (callout is a new type of renderer, again subject to change). There will be a mechanism for registering callbacks from on-click on callout to external js.
The news panel of the right probably wouldn’t be a bokeh primitive. I would recommend writing that in a frontend JS framework such as angular. The news panel would listen to the callout renderer’s onclick to show the right news piece on the screen.
The pieces that bokeh currently lacks that would make such a chart possible are
- time-window-zoom tool. If you are willing to forgo the exact mechanics of google’s implementation, this could probably be accomplished with a box-zoom type tool that displays on P3 but operates on P1/P2’s x-data range
- Better integration for callbacks with external js frameworks. We are still working out the mechanics of how to provide good js level callback hooks.
- I’m fairly sure that Peter and Bryan would say that a layout system (cassowary) is necessary to position plots P1, P2, P3.
- Its possible that we could build the news list as a bokeh widget, but I think it would be awkward. Maybe we could provide a default implemenation for such a linked table, but make it easy for users to extend external to bokeh. I want people to be able to customize bokeh without having to run the bokeh build process. Users should be able to create bokeh widgets with just js, without modifying bokeh.js
I hope this helps Josh. I’m sure Peter, Bryan or Hugo will chime in with additional information.
Thanks,
Paddy
On Mon, Jun 2, 2014 at 10:46 AM, Josh Wasserstein [email protected] wrote:
Google Finance has a nice interactive visualization framework that allows users to see the evolution of stock prices on a chart for a given financial symbol along with a series of tickers on the X-axis. The tickers correspond to items int the “News feed” on the right.
The framework is a nice way to see how specific events in the news could have affected the evolution of stock price.
Can Bokeh currently be used to build this type of visualization? If so, what building blocks would be needed for this?
Thanks!
Josh
–
You received this message because you are subscribed to the Google Groups “Bokeh Discussion - Public” group.
To unsubscribe from this group and stop receiving emails from it, send an email to [email protected].
To post to this group, send email to [email protected].
To view this discussion on the web visit https://groups.google.com/a/continuum.io/d/msgid/bokeh/CAD4ivxWojOd61LpE7tRNeCgb-7c4JAX_%2B%2Bw_175fwoGtVPcNAg%40mail.gmail.com.
For more options, visit https://groups.google.com/a/continuum.io/d/optout.
This should already be doable by giving both plots the same range object for the axis you wish to link. In the python API you can grab the range object off of one object and pass it into the second call
···
On Jun 6, 2014 11:25 AM, [email protected] wrote:
Thanks Paddy for the excellent exposition,it covered a question about linked axes in Bokeh I wished to ask.
Would It be possible currently to link P1 and P2 by axis easily?That would be a sufficient implementation for my use case.
Best
Adain
On Monday, June 2, 2014 4:06:19 PM UTC+1, Paddy Mullen wrote:
Josh,
Thanks for your interest in using Bokeh. In what context would you like to build such a visualization? What development skillsets do you have (this helps me understand how you would be most comfortable customizing Bokeh)?
Bokeh can’t completely do a google finance style plot right now. But we do have plans to be able to implement such functionality. Talking about the building blocks is a helpful excrecise.
The main plot would be a plot called P1.
There would also be a plot P2 for the volume.
Below that there would be another plot for the time window, called P3. This plot would plot on the same datasource, with the same x and y columns, P1 and P3 would have a different datarange object (data ranges control the mapping of data coordinates to screen coordinates) The x range of P1 in the displayed view is a smaller time window then the x range of P3. P1 and P2 would share the same x data range, but have different y-data ranges.
P3 plot would have a special time-window zoom tool (I just made time-window-zoom up, name subject to change). The time window zoom would operate on the datarange of P1 and P2.
P1 would have an additional renderer of type “callout” (callout is a new type of renderer, again subject to change). There will be a mechanism for registering callbacks from on-click on callout to external js.
The news panel of the right probably wouldn’t be a bokeh primitive. I would recommend writing that in a frontend JS framework such as angular. The news panel would listen to the callout renderer’s onclick to show the right news piece on the screen.
The pieces that bokeh currently lacks that would make such a chart possible are
- time-window-zoom tool. If you are willing to forgo the exact mechanics of google’s implementation, this could probably be accomplished with a box-zoom type tool that displays on P3 but operates on P1/P2’s x-data range
- Better integration for callbacks with external js frameworks. We are still working out the mechanics of how to provide good js level callback hooks.
- I’m fairly sure that Peter and Bryan would say that a layout system (cassowary) is necessary to position plots P1, P2, P3.
- Its possible that we could build the news list as a bokeh widget, but I think it would be awkward. Maybe we could provide a default implemenation for such a linked table, but make it easy for users to extend external to bokeh. I want people to be able to customize bokeh without having to run the bokeh build process. Users should be able to create bokeh widgets with just js, without modifying bokeh.js
I hope this helps Josh. I’m sure Peter, Bryan or Hugo will chime in with additional information.
Thanks,
Paddy
On Mon, Jun 2, 2014 at 10:46 AM, Josh Wasserstein [email protected] wrote:
Google Finance has a nice interactive visualization framework that allows users to see the evolution of stock prices on a chart for a given financial symbol along with a series of tickers on the X-axis. The tickers correspond to items int the “News feed” on the right.
The framework is a nice way to see how specific events in the news could have affected the evolution of stock price.
Can Bokeh currently be used to build this type of visualization? If so, what building blocks would be needed for this?
Thanks!
Josh
–
You received this message because you are subscribed to the Google Groups “Bokeh Discussion - Public” group.
To unsubscribe from this group and stop receiving emails from it, send an email to [email protected].
To post to this group, send email to [email protected].
To view this discussion on the web visit https://groups.google.com/a/continuum.io/d/msgid/bokeh/CAD4ivxWojOd61LpE7tRNeCgb-7c4JAX_%2B%2Bw_175fwoGtVPcNAg%40mail.gmail.com.
For more options, visit https://groups.google.com/a/continuum.io/d/optout.
–
You received this message because you are subscribed to the Google Groups “Bokeh Discussion - Public” group.
To unsubscribe from this group and stop receiving emails from it, send an email to [email protected].
To post to this group, send email to [email protected].
To view this discussion on the web visit https://groups.google.com/a/continuum.io/d/msgid/bokeh/44641ab6-ff1f-4a79-9626-27bcb0823078%40continuum.io.
For more options, visit https://groups.google.com/a/continuum.io/d/optout.