I am trying to create a track with lot of rect glyps in many places with a Xaxis that is close to a billion. I want these rectangles only visible when zoomed in to the absolute position of the glyph and remain hidden in the normal view of the figure size.
I was able to do this with a lot of trial and error with line_width, line alpha & fill_alpha properties with the canvas-backed. However, my data size got bigger and I wanted to use WebGL backend to improve performance. It did improve the performance but as a side effect, those rectangles are appearing in normal view without zooming even with the same property settings. I tried adjusting it to the lowest setting, it becomes less visible in normal view and completely invisible when zoomed in (Fig2).
Not sure if it is possible to replicate the same with WebGL backend now. It would be great if there is a way to do this. Can someone please help with this? Below are some examples of the plot and corresponding values used. Please let me know if you need more info. Thanks in advance.
Figure command
plt = figure(sizing_mode="scale_both",  plot_width=1300,  max_width=1450,
                 plot_height=550, tools=tools1, active_scroll='xwheel_zoom',
                 x_range=[1, 3095677412], y_range=[-0.8, 0.8], output_backend="webgl"
                 )
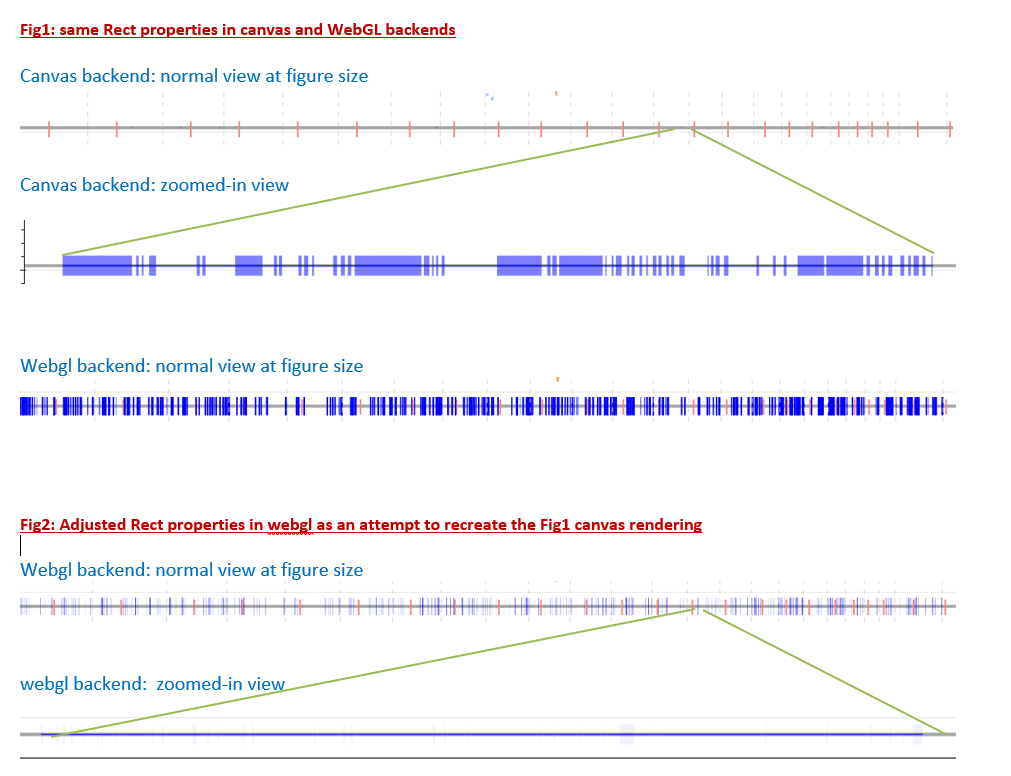
Fig1: same Rect glyph’s property setting used in canvas and webgl backend
rect_glyph = Rect(x="x", y="y", width="w", height="h", fill_alpha=0.5, line_width=0.018, hatch_alpha=0.3, line_alpha=0.050,, fill_color="blue", name='track')
Fig2: adjusted property setting in webgl (to lowest) to recreate the prev canvas rendering
Rect(x="x", y="y", width="w", height="h", fill_alpha=0.05, hatch_alpha=0.1, line_alpha=0, line_width=0,fill_color="blue", name='track')