I tweak on what you advised. Some crucial questions appear in my mind.
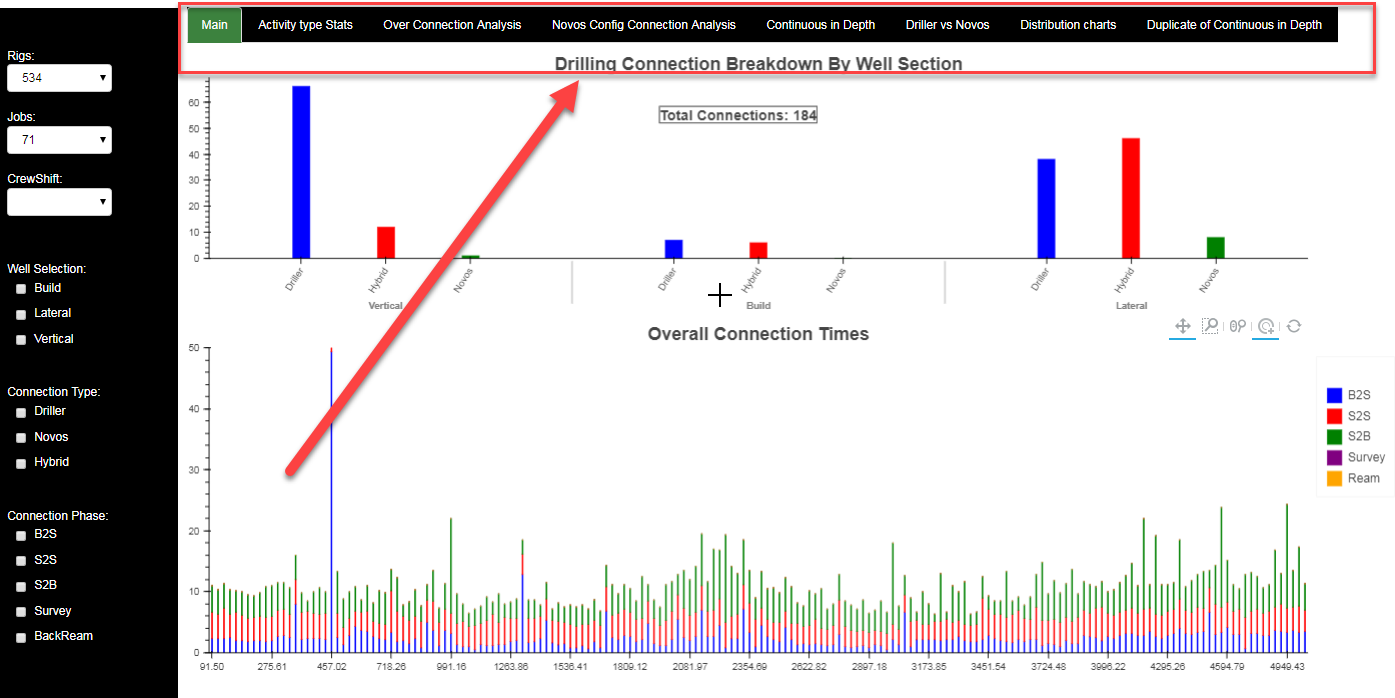
My web application(Flask + Bokeh + Apache) tries to plot some charts on each tab as screenshot shown below.
In my main.py, not too much things need to be done
from DataVisualizationWebApp import app, views
from threading import Thread
import socket
from DataVisualizationWebApp import bk_plotter as bk_plter
import queue
import threading
from DataVisualizationWebApp import import_data
from cheroot.wsgi import Server as WSGIServer
from bokeh.settings import settings as settingManger
#from bokeh.application.handlers.server_lifecycle import ServerLifecycleHandler
settingManger.log_level(“debug”)
bokeh_thread = Thread(name=‘Bokeh_Server’, target=views.bk_worker)
bokeh_thread.start()
que = queue.Queue()
database_thread = Thread(name=‘Database_Server’, target = lambda q, arg1: q.put(import_data.import_all_data(arg1)), args = (que, ‘’))
database_thread.start()
bk_plter.all_connection_dict, bk_plter.novos_connection_dict, \
bk_plter.all_connection_table, bk_plter.novos_connection_table, \
bk_plter.novos_source, bk_plter.rigs_list, \
bk_plter.jobs_list, bk_plter.crewshift_list = que.get()
if name == ‘main’:
server = WSGIServer(bind_addr=('127.0.0.1', 8011), wsgi_app=app, numthreads=10)

try:

    server.start()

except KeyboardInterrupt:

    server.stop()
``
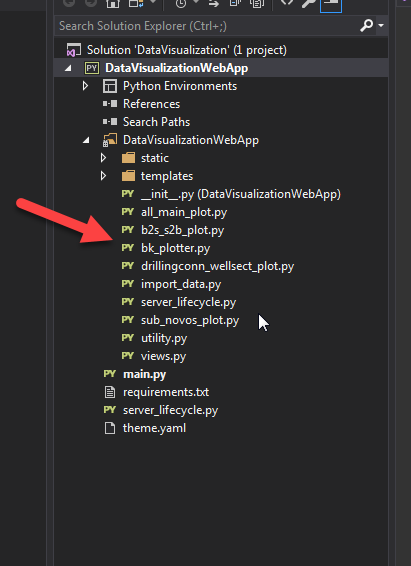
But in my bk_plotter.py which is invoked in view.py like this
#view.py
def bk_worker():
Can’t pass num_procs > 1 in this configuration. If you need to run multiple
processes, see e.g. flask_gunicorn_embed.py
start_time_server = timeit.default_timer()
server = Server({‘/bk_plotter’: bk_plter.plot_doc}, io_loop=IOLoop(), allow_websocket_origin=[“localhost:8011”], websocket_max_message_size = 9999999999 * 1024 * 1024)
server.start()
server.io_loop.start()
print(“\nserver loading time \n”)
print(timeit.default_timer() - start_time_server)
``
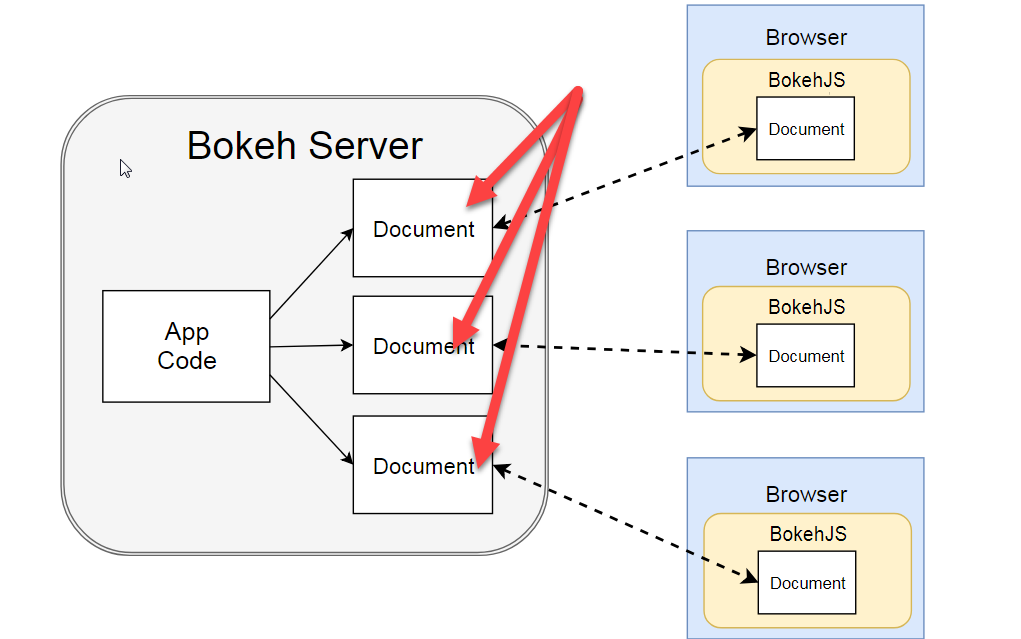
I believe that all charts belongs to and shown on each tab should be done in bk_plotter.py.(Bokeh Server) For example, all figures and DataColumnSources should be created in this file. the reason is sample, because the document should be created as the following screenshot shown(https://bokeh.pydata.org/en/latest/docs/user_guide/server.html)
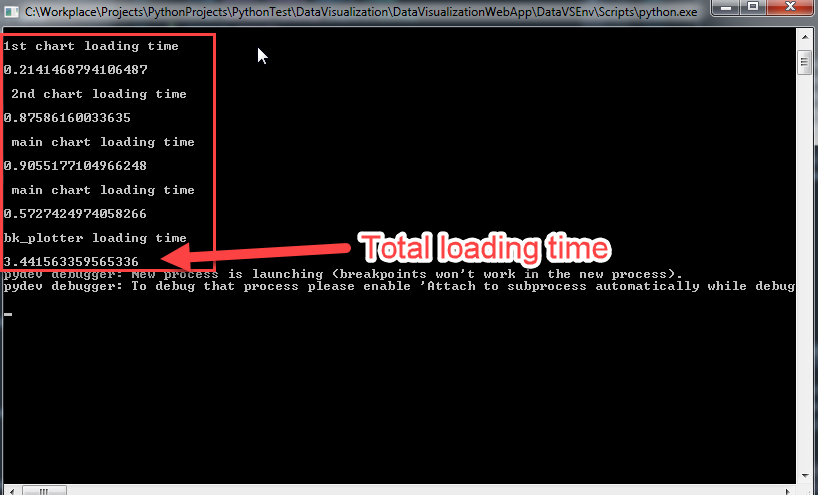
The worst thing is that launching website time takes so long or may be longer if too much things is done in this file.
if I just have one plot in this file, the launching web time is fast based on my tests. I just wonder if this is a Bokeh bottleneck, or I did something wrong.
By the way, just launching time is so long, after website is launched, to manipulate charts or plots, responding time is pretty fast.
any comments are highly appreciated.
Thanks
bk_plotter.py
def plot_doc(doc):
def get_data(all_connection_dict, rig = -1, job = -1):

    pass

def update(all_connection_dict, rig = -1, job = -1, selected = None):

	pass

def update_combBx_values(val, lst, columnName = ''):

	pass

@gen.coroutine

def update_1st_chart(selected_rig, selected_job):

	pass

@gen.coroutine

def update_2nd_chart(selected_rig, selected_job):

	pass

@gen.coroutine

def update_main_plot(selected_rig, \

                selected_job, \

                from_comboBx_group, \

                checkbox_group_1_selections = [],\

                checkbox_group_2_selections = [], \

                checkbox_group_3_selections = []):

	pass

def rigs_combx_change(attrname, old, new):

	pass

def jobs_combx_change(attrname, old, new):

	pass

def crewshift_combx_change(attrname, old, new):

    pass

    #crewshift_combx.options = update_combBx_values(new, rig_number_list, 'Crewshift')


def get_default_value(all_connection_table, comboBx, selectedRig = '', selectedJob = ''):

	pass


# 1st chart

update_drillingconn_wellsect_queue = queue.Queue()

update_drillingconn_wellsect_event = threading.Event()

update_drillingconn_wellsect_thread = Thread(name='update_drillingconn_wellsect_thread', \

                                             target =  lambda q, arg1, arg2, arg3, arg4: \

                                                       q.put(drillingconn_wellsect_plot.update_well_selection_data(arg1, arg2, arg3, arg4)), \

                                             args = (update_drillingconn_wellsect_queue, \

                                                     update_drillingconn_wellsect_event, \

                                                     all_connection_dict, rig, job))

update_drillingconn_wellsect_thread.start()

update_drillingconn_wellsect_event.wait()

well_connection_colors, x, well_connnection_counts, well_connnection_data = update_drillingconn_wellsect_queue.get()

well_connnection_source = ColumnDataSource(data=dict(colors=well_connection_colors, x = x, counts=well_connnection_counts))

#WebGL is a JavaScript API that allows rendering content in the browser via the Graphics Processing Unit (GPU)

well_connection_chart = figure(x_range=FactorRange(*x), \

                               plot_width = 1600, plot_height = 300, \

                               sizing_mode='scale_both', \

                               title="Drilling Connection Breakdown By Well Section", \

                               output_backend="webgl")


well_connection_textbox_source = ColumnDataSource(data=dict(x = [600,], y = [150,],  txt= ['Total Connections: %d' % (total_connections),]))

well_connection_chart_textbox = LabelSet(x='x', y='y', x_units='screen', y_units='screen', \

                                        text='txt', source = well_connection_textbox_source,\

                                        text_font_size="12pt", border_line_color='black', \

                                        border_line_width=1, text_font_style='bold')

well_connection_chart.add_layout(well_connection_chart_textbox)


get_all_data_queue = queue.Queue()

get_all_data_event = threading.Event()

get_all_data_thread = threading.Thread(name='get_all_data_thread', target =  lambda q, arg1, arg2: q.put(all_main_plot.get_all_data(arg1, arg2)), args = (get_all_data_queue, get_all_data_event, all_connection_dict))

get_all_data_thread.start()

get_all_data_event.wait()

mainplot_data_all, depth_list_all = get_all_data_queue.get()


depth_list_all = [str(x) for x in depth_list_all]

main_plot = figure(x_range=FactorRange(), y_range = (0, 50), \

                   plot_width = 1600, plot_height = 400, \

                   tools = "tap, pan, box_zoom, wheel_zoom, reset", \

                   sizing_mode='scale_width', \

                   title="Overall Connection Times",

                   output_backend="webgl")

main_plot.x_range.factors = depth_list_all

mainplot_data_all['HoleDepth'] = ["{0:.2f}".format(x) for x in mainplot_data_all['HoleDepth']]

mainplot_source = ColumnDataSource(data=dict(HoleDepth = mainplot_data_all['HoleDepth'],

                                                VBarTop = mainplot_data_all['VBarTop'],

                                                VBarBottom = mainplot_data_all['VBarBottom'],

                                                VBarColors = mainplot_data_all['VBarColors'],

                                                VBarType = mainplot_data_all['VBarType']))

main_plot.vbar(x = 'HoleDepth', width = 0.1, bottom = 'VBarBottom', top = 'VBarTop', color = 'VBarColors', source = mainplot_source, legend = 'VBarType')

main_plot.legend.location = "top_right"

main_plot.legend.orientation = "vertical"

new_legend = main_plot.legend[0]

main_plot.legend[0].plot = None

main_plot.add_layout(new_legend, 'right')

main_plot.js_on_event(events.Reset, ticker_cb_reset)

checkbox_group_1_selections = []

checkbox_group_2_selections = []

checkbox_group_3_selections = []


def checkbox_callback_1(attr, old, new):

    pass

def checkbox_callback_2(attr, old, new):

	pass

def checkbox_callback_3(attr, old, new):

	pass

checkbox_group_1.on_change('active', checkbox_callback_1)

checkbox_group_2.on_change('active', checkbox_callback_2)

checkbox_group_3.on_change('active', checkbox_callback_3)

from_comboBx_group = False

update_main_plot_queue = queue.Queue()

update_main_plot_event = threading.Event()

update_main_plot_thread = Thread(name='update_main_plot_thread', \

                                 target =  lambda q, arg1, arg2, arg3, arg4, arg5, arg6, arg7, arg8, arg9, arg10, arg11, arg12: q.put(all_main_plot.update_main_plot_chart(arg1, arg2, arg3, arg4, arg5, arg6, arg7, arg8, arg9, arg10, arg11, arg12)), \

                                 args = (update_main_plot_queue, \

                                         doc, \

                                         update_main_plot_event, \

                                         mainplot_source, \

                                         main_plot, \

                                         mainplot_data_all, \

                                         checkbox_group_1_selections, \

                                         checkbox_group_2_selections,\

                                         checkbox_group_3_selections, \

                                         all_connection_dict,\

                                         rig, \

                                         job, \

                                         from_comboBx_group))

update_main_plot_thread.start()

update_main_plot_event.set()


#sub_plot

#sub_plot, subplot_source, subplot_dict = sub_novos_plot.create_sub_plot(doc)

subplot_dict = {}


subplot_source = ColumnDataSource(data=subplot_dict)

# 3. plot

sub_plot = figure(x_range = [0, 60], y_range = [0, 30], \

                 plot_width=1540, plot_height= 350, \

                 toolbar_location=None, \

                 sizing_mode='scale_both', \

                 output_backend="webgl")

drillingConnectionBreakdown_layout = layout(column(sub_plot))

tabMain = Panel(title='Main', child=drillingConnectionBreakdown_layout)

tabMain.tags=["MainTag"]

tabMain.name="MainName"

p1 = figure(plot_width=1200, plot_height=300, output_backend="webgl")

#may be big dataColumnSource in future

tabActivitytypeStats = Panel(title='Activity type Stats', child=right_layout)

tabActivitytypeStats = Panel(child=p1, title='Activity type Stats')

tabActivitytypeStats.tags=["activitytypestatsTag"]

tabActivitytypeStats.name="ActivitytypeStatsName"


p2 = figure(plot_width=1200, plot_height=300, output_backend="webgl")

#may be big dataset in future

p2.line([1, 2, 3, 4, 5], [6, 7, 2, 4, 5], line_width=3, color="navy", alpha=0.5)

#tabOverConnectionAnalysis = Panel(child=None, title="Over Connection Analysis")

tabOverConnectionAnalysis = Panel(child=p2, title="Over Connection Analysis")

tabOverConnectionAnalysis.name="OverConnectionAnalysisName"

tabOverConnectionAnalysis.tags=["OverConnectionAnalysisTag"]


p3 = figure(plot_width=1200, plot_height=300, output_backend="webgl")

# may be big dataset in future

p3.line([1, 2, 3, 4, 5], [16, 17, 12, 10, 18], line_width=3, color="red", alpha=0.5)

#tabNovosConfigConnectionAnalysis = Panel(child=None, title="Novos Config Connection Analysis")

tabNovosConfigConnectionAnalysis = Panel(child=p3, title="Novos Config Connection Analysis")

tabNovosConfigConnectionAnalysis.name="NovosConfigConnectionAnalysisName"

tabNovosConfigConnectionAnalysis.tags=["NovosConfigConnectionAnalysisTag"]

p4 = figure(plot_width=1200, plot_height=300, output_backend="webgl")

# may be big dataset in future

p4.line([1, 2, 3, 4, 5], [16, 17, 12, 10, 18], line_width=3, color="purple", alpha=0.5)

#tabContinuousInDepth = Panel(child=None, title="Continuous in Depth")

tabContinuousInDepth = Panel(child=p4, title="Continuous in Depth")

tabContinuousInDepth.name="ContinuousinDepthName"

tabContinuousInDepth.tags=["ContinuousinDepthTag"]

p5 = figure(plot_width=1200, plot_height=300, output_backend="webgl")

# may be big dataset in future

p5.line([1, 2, 3, 4, 5], [16, 17, 12, 10, 18], line_width=3, color="grey", alpha=0.5)

#tabDrillervsNovos = Panel(child=None, title="Driller vs Novos")

tabDrillervsNovos = Panel(child=p5, title="Driller vs Novos")

tabDrillervsNovos.name="DrillervsNovosName"

tabDrillervsNovos.tags=["DrillervsNovosTag"]

p6 = figure(plot_width=1200, plot_height=300, output_backend="webgl")

# may be big dataset in future

p6.line([1, 2, 3, 4, 5], [16, 17, 12, 10, 18], line_width=3, color="orange", alpha=0.5)

#tabDistributioncharts = Panel(child=None, title="Distribution charts")

tabDistributioncharts = Panel(child=p6, title="Distribution charts")

tabDistributioncharts.name="DistributionchartsName"

tabDistributioncharts.tags=["DistributionchartsTag"]

p7 = figure(plot_width=1200, plot_height=300, output_backend="webgl")

# may be big dataset in future

p7.line([1, 2, 3, 4, 5], [16, 17, 12, 10, 18], line_width=3, color="black", alpha=0.5)


tabDuplicateofContinuousinDepth = Panel(child=p7, title="Duplicate of Continuous in Depth")

#tabDuplicateofContinuousinDepth = Panel(child=None, title="Duplicate of Continuous in Depth")

tabDuplicateofContinuousinDepth.name="DuplicateofContinuousinDepthName"

tabDuplicateofContinuousinDepth.tags=["DuplicateofContinuousinDepthTag"]


tabs = Tabs(tabs=[tabMain, tabActivitytypeStats, tabOverConnectionAnalysis, tabNovosConfigConnectionAnalysis, \

                  tabContinuousInDepth, tabDrillervsNovos, tabDistributioncharts, tabDuplicateofContinuousinDepth])


tabs.css_classes = ["tabsbackgroundcolorblack"]


spacer_3 = Spacer(width=120, height=350)

main_row = row(tabs)

main_row.css_classes = ["mainrowlayout"]

main_layout = layout(main_row, sizing_mode=sizing_mode)

main_layout.css_classes = ["mainlayout"]

doc.add_root(main_layout)

doc.theme = Theme(filename="theme.yaml")
``
···
On Tuesday, September 4, 2018 at 2:58:52 PM UTC-6, Bryan Van de ven wrote:
Hi,
The only time I have seen a delay like this, it is due to the app code doing lots of work. Is your script or main.py (which is run on every connection) doing 20 seconds of blocking work?
Bryan
On Sep 4, 2018, at 13:55, peng wang [email protected] wrote:
Hi guys,
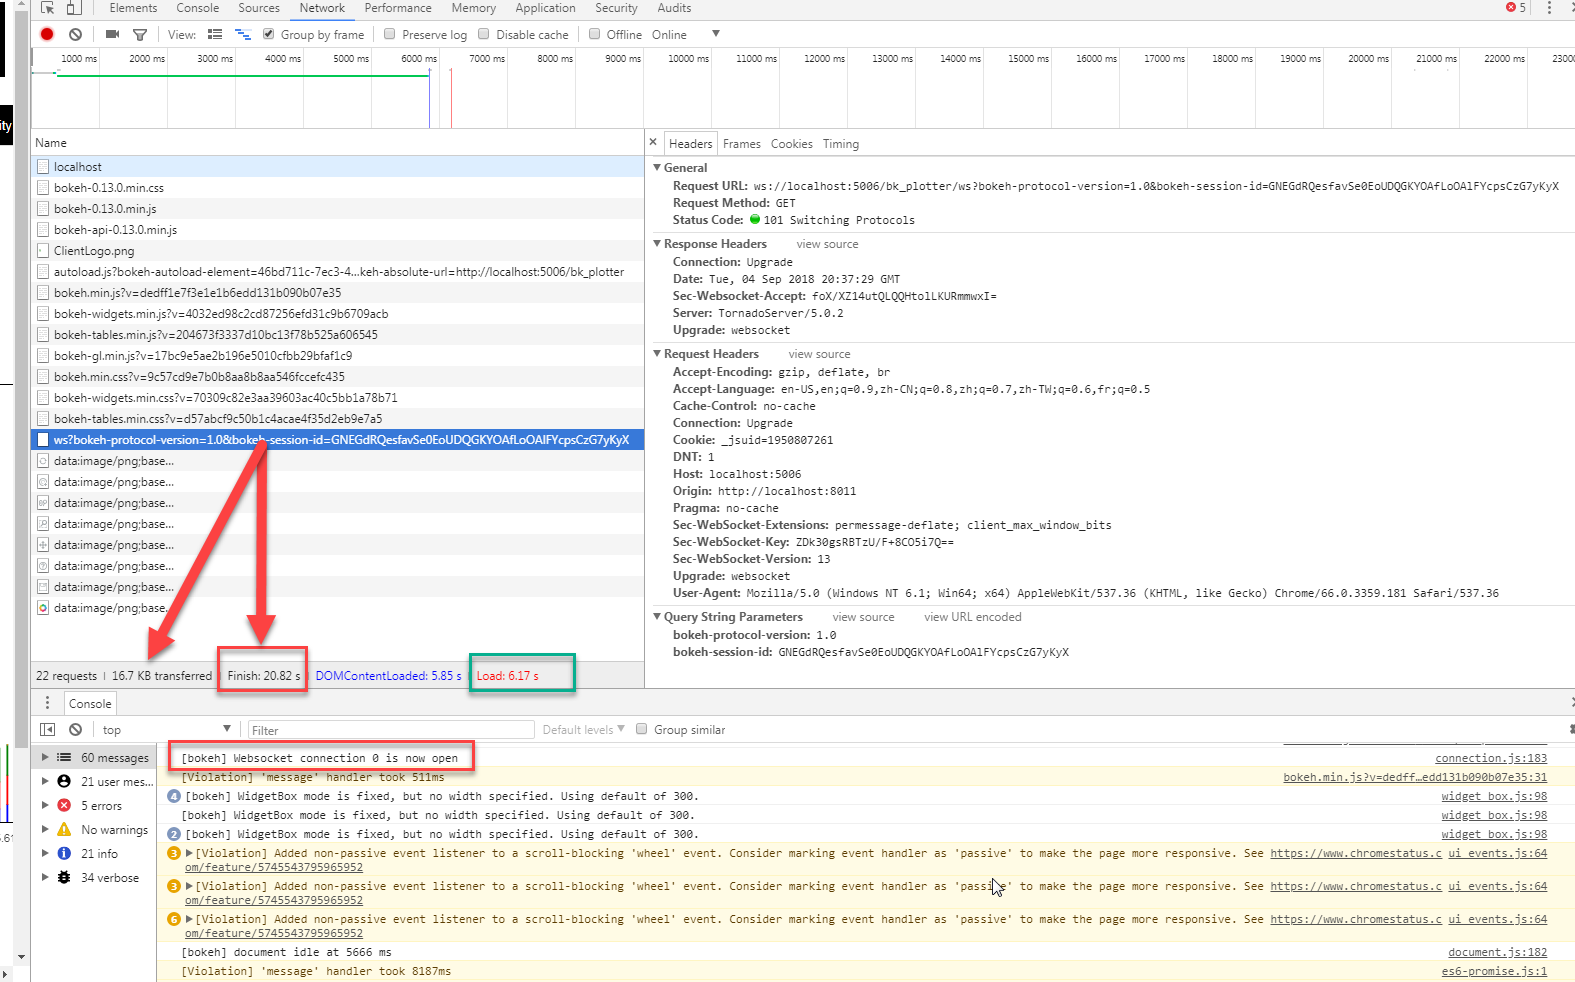
I create an embedded bokeh server Flask app, and run it locally. There is a wired problem: after loading document(5.85s, OK), wsSocket takes around 20s to finish just 16.78 KB transfered as screenshot shown below.
I mean 20 seconds is so long for launching entire website. Flask responses pretty fast. I have no idea about this issue. Any clues or hints are definitely appreciated.
<2018-09-04_14-44-23.png>
–
You received this message because you are subscribed to the Google Groups “Bokeh Discussion - Public” group.
To unsubscribe from this group and stop receiving emails from it, send an email to [email protected].
To post to this group, send email to [email protected].
To view this discussion on the web visit https://groups.google.com/a/continuum.io/d/msgid/bokeh/1949bace-b4ee-4dc4-84f7-5eda230025f2%40continuum.io.
For more options, visit https://groups.google.com/a/continuum.io/d/optout.
<2018-09-04_14-44-23.png>