Weird glitch when updating plot with TapTool with only certain data sources

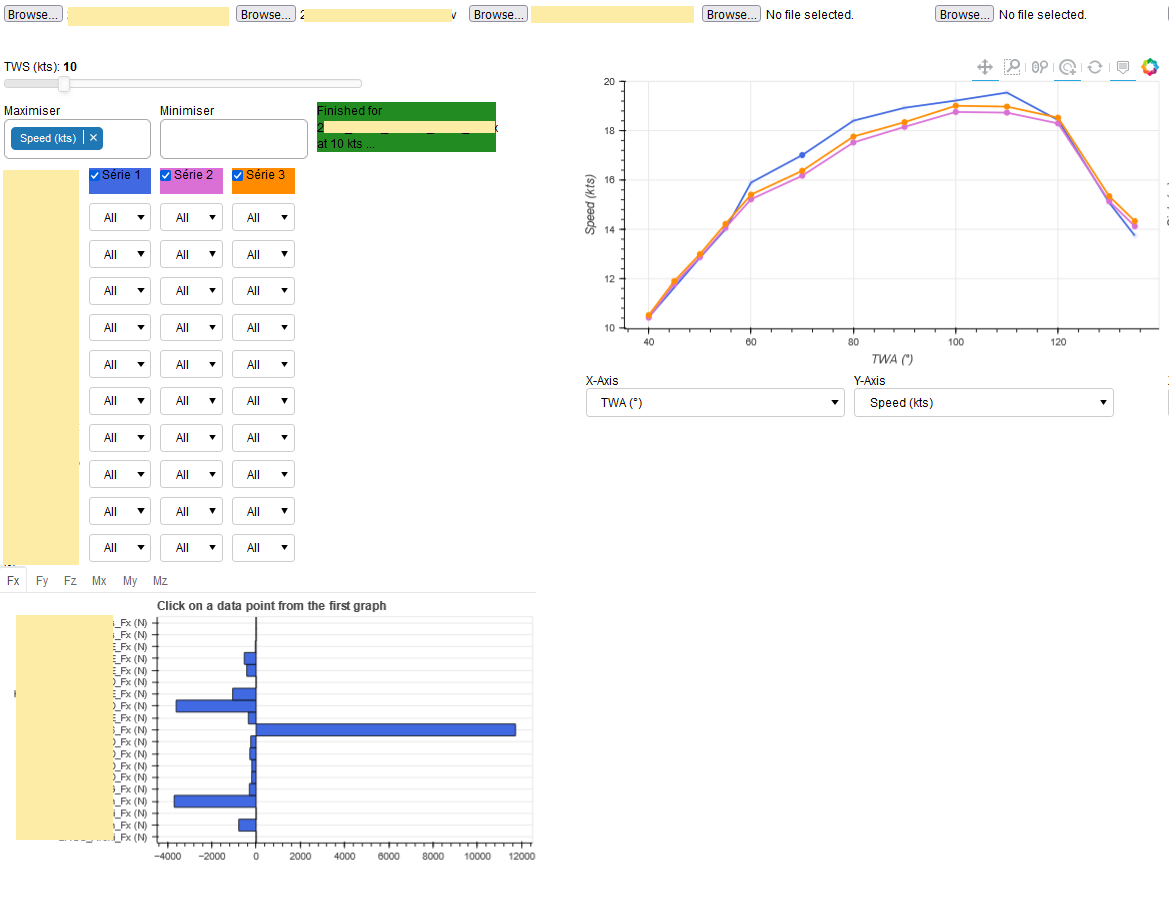
I’ve managed to create an interactive plot that contains several series. When I click on one of a glyph on one serie, a histogram plot is updated and print the forces associated with this glyph.
To walk you through the code, I start by uploading a csv that all contain loads of data with the same column names. Then the code reads the csv and filters it with different widgets and only plot the filtered data. So I end up with a graph with different lines corresponding to each filtered csv. Because the function I’ve created to create the histogram doesn’t know which serie I’m clicking on, I’ve worked around this by adding the forces I want to plot to the data of the column data source of each serie. I store them like you store hover points.
And everything works like a charm except when I’m adding the forces in the column data source. To do this, I filter each serie and take only the column that contains ‘Fx [N]’, ‘Fy [N]’, etc… and then add it to the source.
This used to work well but for some reason, sometimes nothing shows on the graph even if I can easily print the data and bokeh has no problem reading and finding it. So nothing shows up on the graph and I can’t click on any point to show the forces after.
Bokeh doesn’t print any error.

The first code is a function called whenever I filter the data with one of the widget. It updates the data source and plots the new line. (I’ll put a screenshot of what it looks like below) If I remove the ‘fx’, ‘fy’, etc in the source_p1[j].data, it works again but I can’t plot the histogram.

    def update_p1_serie(given_serie, j):
        p1.xaxis.axis_label = x_p1.value
        p1.yaxis.axis_label = y_p1.value

        if not given_serie.empty:
            given_serie.sort_values(by=[x_p1.value], inplace=True)
            xs_p1 = given_serie[x_p1.value].values
            ys_p1 = given_serie[y_p1.value].values
            forces_data_fx = given_serie.filter(like='Fx (N)')
            forces_data_fy = given_serie.filter(like='Fy (N)')
            forces_data_fz = given_serie.filter(like='Fz (N)')
            forces_data_mx = given_serie.filter(like='Mx (N.m)')
            forces_data_my = given_serie.filter(like='My (N.m)')
            forces_data_mz = given_serie.filter(like='Mz (N.m)')

            source_p1[j].data = dict(x=xs_p1, y=ys_p1, hover102=given_serie[para102],
                                     hover103=given_serie[para103], hover104=given_serie[para104],
                                     hover105=given_serie[para105], hover1=given_serie[para1],
                                     hover2=given_serie[name_para2], hover3=given_serie[name_para3],
                                     hover4=given_serie[para4], hover5=given_serie[para5],
                                     hover6=given_serie[para6], hover7=given_serie[para7],
                                     hover8=given_serie[para8], hover9=given_serie[para9],
                                     hover10=given_serie[para10], hover11=given_serie[para11], fx=forces_data_fx,
                                     fy=forces_data_fy, fz=forces_data_fz, mx=forces_data_mx, my=forces_data_my,
                                     mz=forces_data_mz)

            p1.line(x='x', y='y', source=source_p1[j], line_color=colors[j], line_width=2, alpha=1,
                    name=series_name[j])
            r1 = p1.circle(x='x', y='y', source=source_p1[j], color=colors[j], size=6, alpha=1, hover_alpha=1,
                           name=series_name[j])

        else:
            source_p1[j].data = dict(x=[], y=[])

This second code is the function called when I click on a glyph and that plots the histogram. It shouldn’t be the problem since it’s not even called before the problem. (I only show the example for ‘fx’ since I do the same for the other forces)

    def update_bar(event):
        SELECTED = [None] * (len(source_p1))

        for j, source in enumerate(source_p1):
            SELECTED[j] = source_p1[j].selected.indices
            if len(SELECTED[j]) > 1:
                SELECTED[j] = SELECTED[j][-1]

            if SELECTED[j]:
                values_fx = []
                values_fy = []
                values_fz = []
                values_mx = []
                values_my = []
                values_mz = []

                for i, column in enumerate(source_p1[j].data['fx'].columns.tolist()):
                    values_fx.append(source_p1[j].data['fx'][column][SELECTED[j]].values.tolist())
                values_fx = [x[0] for x in values_fx]
                data_dict_fx = {'column': forces_name_fx, 'top': values_fx}
                source_bar_fx.data = data_dict_fx
                bar_fx.hbar(y='column', right='top', width=0.9, source=source_bar_fx,
                         line_color='black', color=colors[j])
                bar_fx.xgrid.grid_line_color = None
                bar_fx.add_tools(HoverTool(tooltips=[('Série', series_name[j]), ('Modèle', "@column"), ('Valeur', '@top')]))

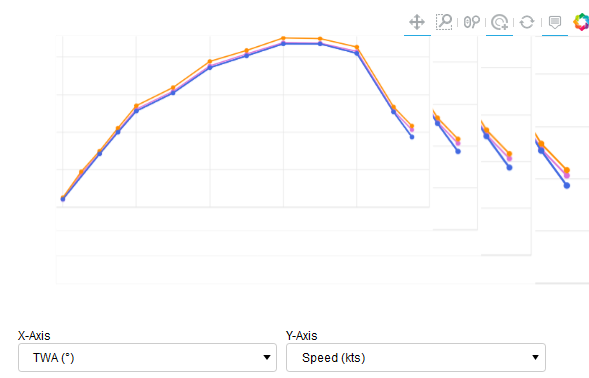
The first photo is when everything works, I’ve clicked on a point and it prints the forces associated with it. The second one is after I started filtered a bit more or just changing certain values, it starts glitching like that. I’ve also noticed that it usually shows something on the graph when I haven’t yet filtered the data except when the csv file has less than 9 lines which is even stranger.


screen_graphe_marche_âs

Is there something I’m missing ? Or is there a different solution I should be using that could do the same thing ?
Hopefully I was clear enough, let me know if you need more info to understand the problem. I can’t unfortunately put the entire code as it’s confidential and pretty long.
Any help would be greatly appreciated.

Your description of what’s happening kinda “smells” related to a super weird issue I’ve raised - you may being triggering it via a python-based filter instead of my CustomJSFilter setup. See [BUG] CDSView/CustomJSFilter correct rendering failing dependent on number of indices? · Issue #12041 · bokeh/bokeh · GitHub .

However, your code and explanation is not distilled down and/or complete/reproducible enough for me to be certain this is the same thing. I’d suggest really distilling this down to a minimal example where you can trigger the same behaviour with dummy data, and come back with that.

I think this might actually be related. I’ve tried distilling the code a lot but it’s still quite dense so sorry about that. Some of the grammar might be weird as well but it’s because in the real code I’ve got 4 graphs and up to 6 csv uploaded with around 11 widgets for each csv.
So here is the code that triggers the same behaviour:

from bokeh.models.tools import HoverTool
from bokeh.plotting import figure, show
import pandas as pd
from bokeh.layouts import column, row, grid
from bokeh.models import Select, FileInput, Slider, Button, ColumnDataSource
from bokeh.models import PanTool, ResetTool, BoxZoomTool, WheelZoomTool, Paragraph, TapTool
from bokeh.events import Tap
from pybase64 import b64decode
import io
from bokeh.io import curdoc

series = [None] * 6
update_marker = None

# Parameters
para1 = 'Speed (kts)'
para2 = ["Flying", "LWD_WWD", "WWD", "Unknown"]
name_para2 = 'CONFIG'
para100 = 'TWA (°)'
para101 = 'TWS (kts)'


def upload_data1(attr, old, new):
    decoded = b64decode(file_input1.value)
    f = io.BytesIO(decoded)
    data1 = pd.read_csv(f, sep=';')
    data1 = data1.loc[:, ~data1.columns.str.contains('^Unnamed')]
    data1.name = file_input1.filename.split('.')[0]
    series[0] = data1


def load_data():
    columns = sorted(series[0].columns)
    layout1 = plotting(series, columns)
    curdoc().add_root(layout1)
    curdoc().title = "Post Traitement"
    show(layout1)


file_input1 = FileInput(accept=".csv", width=250)
file_input1.on_change('filename', upload_data1)

bt = Button(label="Load data", width=150, height=50)
bt.on_click(load_data)

data_set = row(children=[file_input1, bt])
curdoc().add_root(data_set)
show(data_set)


def plotting(series, columns):
    global layout, update_marker
    if update_marker is not None:
        layout.children.remove(layout.children[0])

    values_fx = []
    forces_name_fx = list(filter(lambda k: 'Fx (N)
' in k, series[0].columns))
    data_dict_fx = {'column': forces_name_fx, 'top': values_fx}
    tools = [BoxZoomTool(), PanTool(), ResetTool(), WheelZoomTool(), TapTool(),
             HoverTool(tooltips=[("Série", "$name"),
                                 ("  ", "  "),
                                 ("x-axis", "@x"),
                                 ("y-axis", "@y")], mode="mouse")]
    p1 = figure(tools=tools, toolbar_location='above', height=350, width=650, output_backend="webgl")
    source_p1 = ColumnDataSource(series[0])
    bar_fx = figure(y_range=forces_name_fx, height=300, toolbar_location=None, title='Click on a data point from the first graph', title_location="above")
    source_bar_fx = ColumnDataSource(data=data_dict_fx)

    def update_bar(event):
        SELECTED = source_p1.selected.indices

        if SELECTED:
            values_fx = []
            for i, column in enumerate(source_p1.data['fx'].columns.tolist()):
                values_fx.append(source_p1.data['fx'][column][SELECTED].values.tolist())
            values_fx = [x[0] for x in values_fx]
            data_dict_fx = {'column': forces_name_fx, 'top': values_fx}
            source_bar_fx.data = data_dict_fx
            bar_fx.hbar(y='column', right='top', width=0.9, source=source_bar_fx,
                     line_color='black', color='royalblue')

    def update_serie1(attr, old, new):
        source_p1.selected.indices = []
        df1_1 = series[0].loc[(series[0][para101] == float(bt0.value))]
        if bt1_2.value == "All":
            df1_2 = df1_1
        else:
            df1_2 = df1_1.loc[(df1_1[name_para2] == str(bt1_2.value))]
        update_p1_serie(df1_2)

    def update_p1_serie(given_serie):
        p1.xaxis.axis_label = x_p1.value
        p1.yaxis.axis_label = y_p1.value
        if not given_serie.empty:
            xs_p1 = given_serie[x_p1.value].values
            ys_p1 = given_serie[y_p1.value].values
            #####
            source_p1.data = dict(x=xs_p1, y=ys_p1, fx=given_serie.filter(like='Fx (N)'))  # this line is the issue
            # if you put 'source_p1.data = dict(x=xs_p1, y=ys_p1)', it works

            p1.line(x='x', y='y', source=source_p1, line_color='royalblue', line_width=2, alpha=1,
                    name=series[0].name)
            p1.circle(x='x', y='y', source=source_p1, color='royalblue', size=6, alpha=1, hover_alpha=1,
                           name=series[0].name)
        else:
            source_p1.data = dict(x=[], y=[])

    p1.on_event(Tap, update_bar)
    bt0 = Slider(title=para101, value=14, start=14, end=18, step=2, width=400)
    bt0.on_change('value_throttled', update_serie1)

    x_p1 = Select(title="X-Axis", value=para100, options=columns)
    x_p1.on_change('value', update_serie1)
    y_p1 = Select(title='Y-Axis', value=para1, options=columns)
    y_p1.on_change('value', update_serie1)

    text_b2 = Paragraph(text=name_para2, width=85, height=30)
    bt1_2 = Select(value="All", options=para2, width=80)
    bt1_2.options.insert(0, "All")
    bt1_2.on_change('value', update_serie1)

    axis1 = row([x_p1, y_p1], width=600)
    row3 = row([text_b2, bt1_2])
    graphs = grid(children=[[p1], [axis1]])
    parameters = grid(children=[[bt0], [row3], [bar_fx]])
    layout = column(row(children=[parameters, graphs], sizing_mode="scale_width"))
    update_marker = layout

    return layout
    # bokeh serve --websocket-max-message-size 100000000 ex_bokeh_community

And here is the data that works with the code : (I don’t know how to upload a csv)

Model1.Fx (N) Model2.Fx (N) Model3.Fx (N) Model4.Fx (N) Model5.Fx (N) Model6.Fx (N) Model7.Fx (N) Model8.Fx (N) Model9.Fx (N) Model10.Fx (N) Speed (kts) TWA (°) TWS (kts) CONFIG
0 1100 -351 -1500 -800 -500 -1854 0 -1587 30000 40 60 16 Flying
0 1222 -678 -200 -7452 -600 -1822 0 -1600 26000 35 70 16 Flying
0 1344 -1005 -6857 -5662 -900 -1790 0 -1613 18000 32 80 16 LWD_WWD
0 1466 -1332 -8209 -9500 -1067 -1758 0 -1626 12667 30 90 16 WWD
0 1588 -1659 -10888 -11931 -1267 -1726 0 -1639 6667 27 100 16 Flying
0 1710 -1986 -13566 -14362 -1467 -1694 0 -1652 667 24 110 16 WWD
0 1832 -2313 -16245 -16793 -1667 -1662 0 -1665 -5333 20 120 16 LWD_WWD
0 1954 -2640 -18923 -19224 -1867 -1630 0 -1678 -11333 17 130 16 Flying
0 2076 -2967 -21602 -21655 -2067 -1598 0 -1691 -17333 14 140 16 LWD_WWD
0 2198 -3294 -24280 -24086 -2267 -1566 0 -1704 -23333 11 150 16 Flying

To make everything work, I usually use the last line of the code in the terminal.

  1. Then you need to create a csv with the data above.
  2. Upload it to bokeh then click on ‘Load data’.
  3. Then put the TWS to 16 (something should appear).
  4. Click on one point in the graph (the histogram should appear)
  5. Play with the config widget and try different values. At some point, the glitch should appear and it doesn’t work anymore

Hopefully, this should be enough for you to work with. Let me know if you think it is indeed the same issue.

Any ideas ? Does anyone else run into the same problem ?

I can’t parse your csv with the code you’ve provided → I have no idea what what you’re doing with pybase64 and specifying ‘;’ as the separator. I’ve tried making the csv tab separated (that’s what i get when i copy paste your data, I’ve tried making it comma separated, and I’ve tried making it semicolon separated… in every case clearly it is not parsing correctly:

That’s very weird. I’m usually saving the csv as a csv utf-8.
And ofr the pybase64, I’m not sure what happens behind it but I followed an example that I saw and it’s working for me. Is there a way to upload a file in this convo ?

This topic was automatically closed 90 days after the last reply. New replies are no longer allowed.