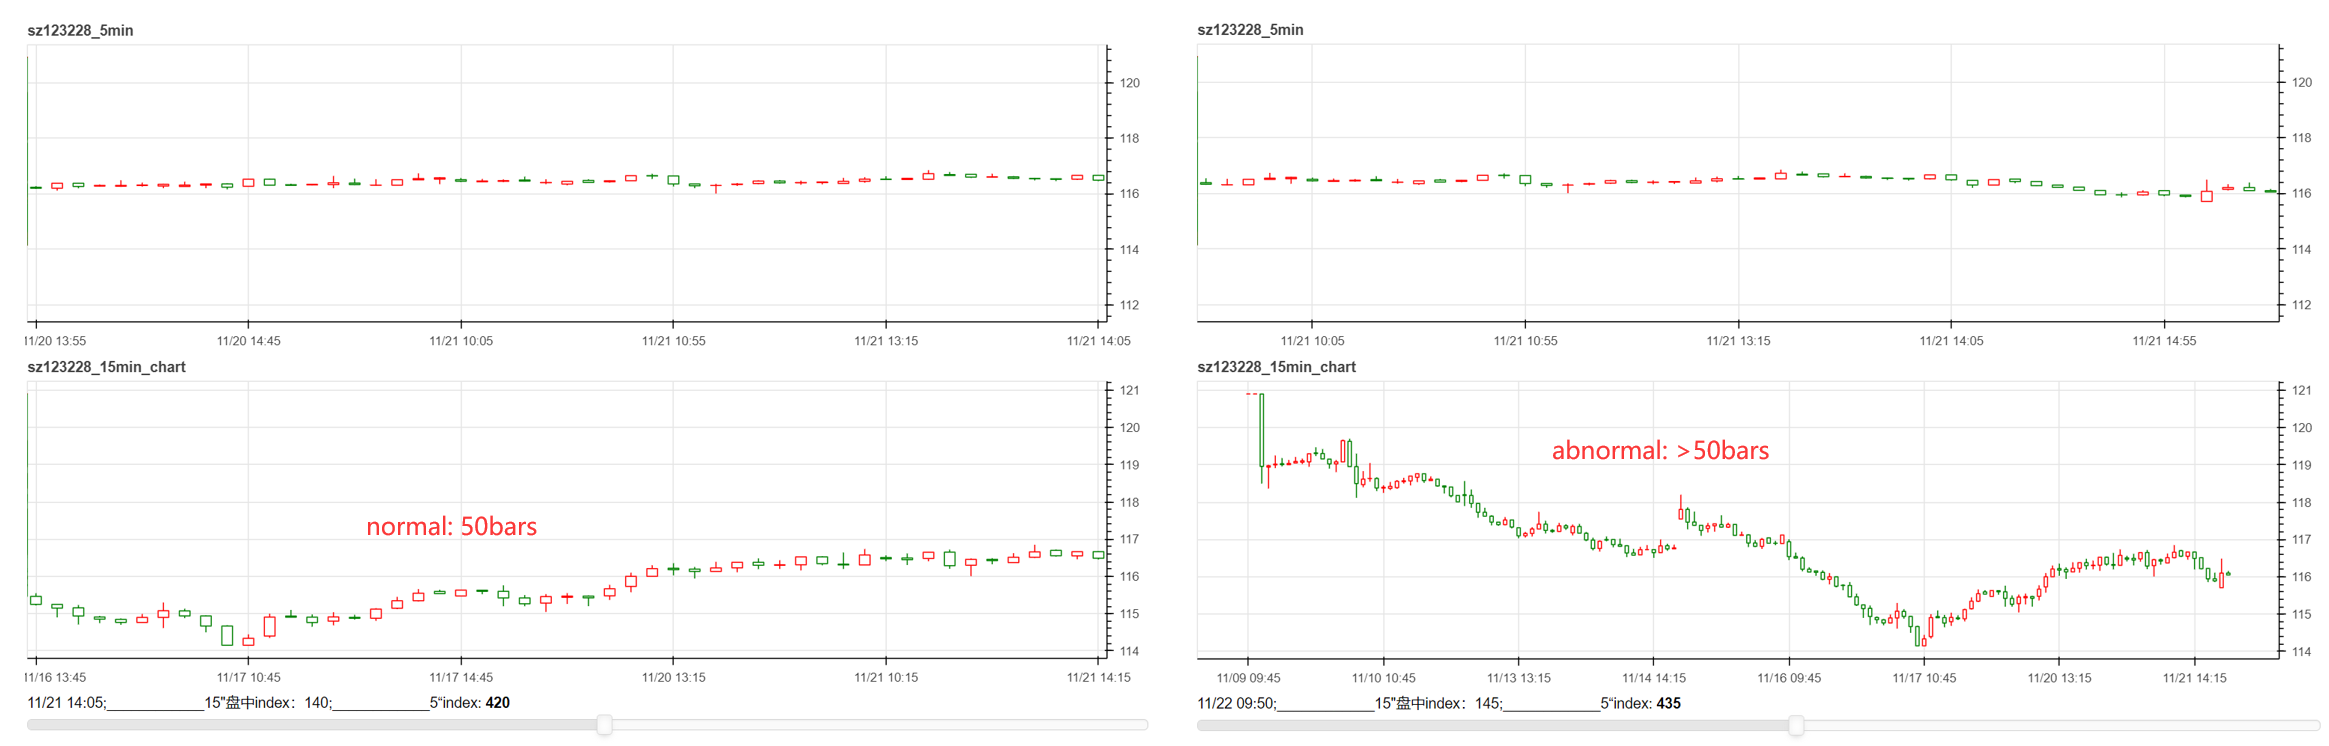
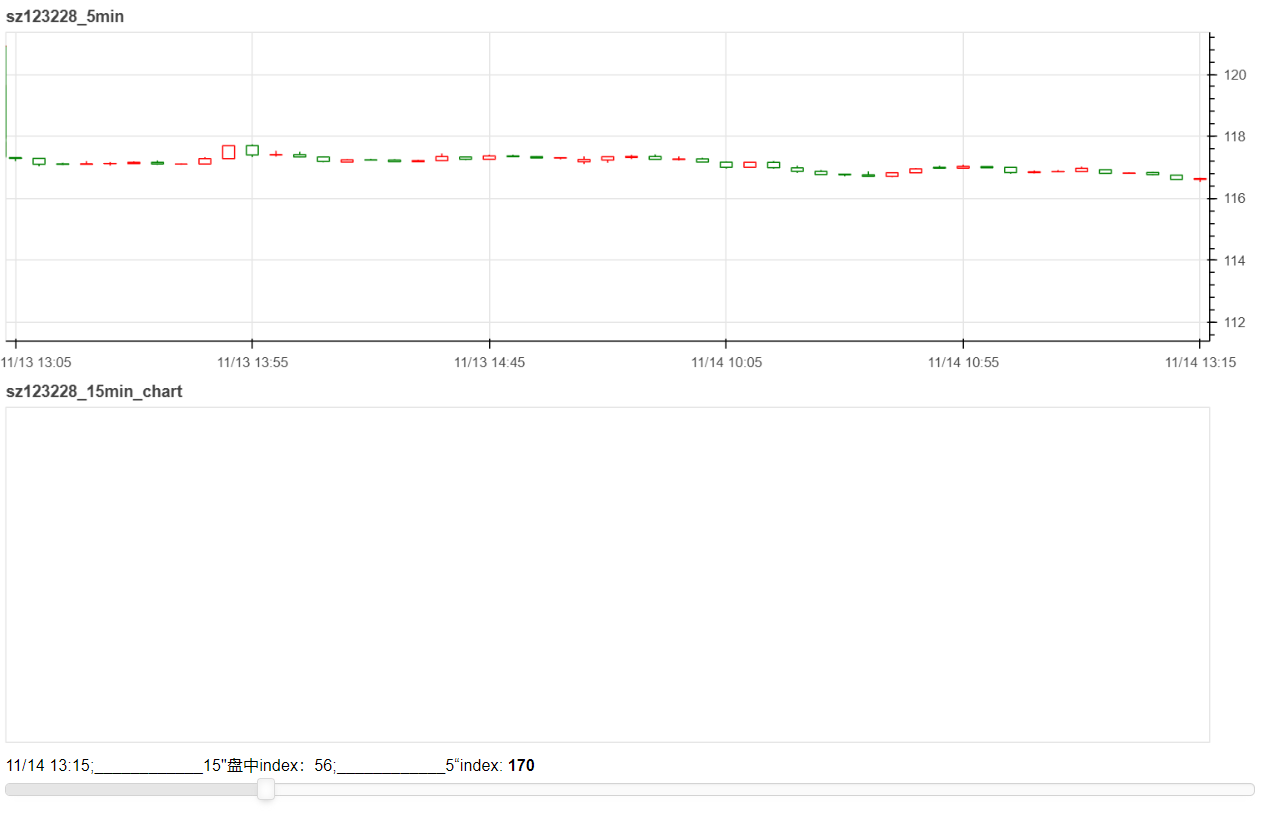
When dragging the slider, the 15 minute candle chart does not update, but the 5-minute candlestick chart updates.
from bokeh.plotting import figure, curdoc
from bokeh.models import ColumnDataSource, HoverTool, Slider
import pandas as pd
from bokeh.layouts import gridplot
import os


script_dir = os.path.dirname(os.path.abspath(__file__))
# 加载5分钟数据
csv_file_5min = os.path.join(script_dir, 'sz123228_5min.csv')
df_5min = pd.read_csv(csv_file_5min)
df_5min["date"] = pd.to_datetime(df_5min["date"])
# 创建5分钟图表
p_5min = figure(x_axis_type="datetime", title=f"sz123228_5min", width=1000, height=300, y_axis_location="right")
p_5min.xaxis.major_label_overrides = {i: date.strftime('%m/%d %H:%M') for i, date in zip(df_5min.index, df_5min["date"])}
inc = df_5min.close >= df_5min.open
dec = df_5min.open > df_5min.close
source_inc_5min = ColumnDataSource(df_5min[inc])
source_dec_5min = ColumnDataSource(df_5min[dec])
p_5min.segment(x0='index', y0='high', x1='index', y1='low', source=source_inc_5min, color="red")
p_5min.segment(x0='index', y0='high', x1='index', y1='low', source=source_dec_5min, color="green")
p_5min.vbar(x='index', width=0.5, top='open', bottom='close', source=source_inc_5min, fill_color="white", line_color="red", line_width=1)
p_5min.vbar(x='index', width=0.5, top='open', bottom='close', source=source_dec_5min, fill_color="white", line_color="green", line_width=1)

# 加载15分钟终表数据
csv_file_15min_chart = os.path.join(script_dir, 'sz123228_15min_chart.csv')
df_15min_chart = pd.read_csv(csv_file_15min_chart)
df_15min_chart["date"] = pd.to_datetime(df_15min_chart["date"])
# 创建15分钟终表图表
p_15min = figure(x_axis_type="datetime", title=f"sz123228_15min_chart", width=1000, height=300, y_axis_location="right")
p_15min.xaxis.major_label_overrides = {i: date.strftime('%m/%d %H:%M') for i, date in zip(df_15min_chart.index, df_15min_chart["date"])}
inc_15min = df_15min_chart.close >= df_15min_chart.open
dec_15min = df_15min_chart.open > df_15min_chart.close
source_inc_15min = ColumnDataSource(df_15min_chart[inc_15min])
source_dec_15min = ColumnDataSource(df_15min_chart[dec_15min])
p_15min.segment(x0='index', y0='high', x1='index', y1='low', source=source_inc_15min, color="red")
p_15min.segment(x0='index', y0='high', x1='index', y1='low', source=source_dec_15min, color="green")
p_15min.vbar(x='index', width=0.5, top='open', bottom='close', source=source_inc_15min, fill_color="white", line_color="red", line_width=1)
p_15min.vbar(x='index', width=0.5, top='open', bottom='close', source=source_dec_15min, fill_color="white", line_color="green", line_width=1)

hover = HoverTool()
hover.tooltips = [("日期", "@date{%F %H:%M}"), ("开盘价", "@open{0,0.000}"), ("最高价", "@high{0,0.000}"), ("最低价", "@low{0,0.000}"), ("收盘价", "@close{0,0.000}")]
hover.formatters = {'@date': 'datetime'}
p_5min.add_tools(hover)
p_15min.add_tools(hover)

initial_date = df_5min["date"].iloc[0].strftime('%m/%d %H:%M')
slider = Slider(start=0, end=len(df_5min), value=len(df_5min), step=1, title=f'起点: {initial_date}', width=1000)

# 加载15分钟中间过程数据
csv_file_15min_process = os.path.join(script_dir, 'sz123228_15min.csv')
df_15min_process = pd.read_csv(csv_file_15min_process)
df_15min_process["date"] = pd.to_datetime(df_15min_process["date"])


def slider_callback(attr, old_range, new_range):
    end_idx = int(slider.value)
    if end_idx >= len(df_5min):
        end_idx = len(df_5min) - 1

    temp = int(end_idx / 3)  # 15"盘中索引号
    df_intraday = pd.DataFrame(columns=df_15min_chart.columns)  # 创建 15" 盘中ohlc df二维的数据结构
    for i in range(temp):
        df_intraday.loc[i] = df_15min_chart.loc[i]
    df_intraday.loc[temp] = df_15min_process.loc[end_idx]
    print(df_intraday)

    inc_15min = df_intraday.close >= df_intraday.open
    dec_15min = df_intraday.open > df_intraday.close
    source_inc_15min.data = df_intraday[inc_15min].to_dict('list')
    source_dec_15min.data = df_intraday[dec_15min].to_dict('list')

    selected_date_5min = df_5min["date"].iloc[end_idx].strftime('%m/%d %H:%M')
    slider.title = f'{selected_date_5min};____________15"盘中index:{temp};____________5“index'
    p_5min.x_range.start = df_5min.index[max(0, end_idx-50)] - 0.4
    p_5min.x_range.end = df_5min.index[end_idx] + 0.4
    p_15min.x_range.start = df_intraday.index[max(0, temp-50)] - 0.4
    p_15min.x_range.end = df_intraday.index[temp] + 0.4
    p_15min.add_tools(hover)

slider.on_change('value', slider_callback)
app_layout = gridplot([[p_5min], [p_15min], [slider]])
curdoc().add_root(app_layout)
Download the attachment from the link below: