Why does the figure be stop updated after 5 runs with datetime x-axis?

My objective: I am writing a real time monitoring system such as monitoring the machine efficiency of a factory.
My tools: a bokeh figure with line glyph in bokeh server
Executing command: bokeh serve --show allMachineEffiencyTest.py --address 120.xxx.xxx.xxx --allow-websocket-origin=120.xxx.xxx.xx:xxxx --port xxxx

# allMachineEffiencyTest.py
from bokeh.layouts import gridplot, column
from bokeh.models import ColumnDataSource, Div, HoverTool, BoxAnnotation
from bokeh.plotting import curdoc, figure
from userRight import mac_is_valid
import numpy as np
from datetime import datetime, timedelta
from numpy import arange, linspace, pi, sin

print(allMachineEffiencyToday())
x = 0.0
def allMachineEffiencyToday():
	def update_xaxis(plot, timeArray):
		plot.x_range.start = min(timeArray)
		plot.x_range.end   = datetime.fromtimestamp(((max(timeArray) - np.datetime64('1970-01-01T00:00:00Z') - np.timedelta64(8, 'h')) / np.timedelta64(1, 's')))
		if (min(timeArray) == max(timeArray)):
			plot.x_range.end = plot.x_range.end + timedelta(minutes = 5)

	def update_yAxis(plot, valueArray):
		plot.y_range.start = -1.0
		plot.y_range.end = 1.0
		
	def dateTime(x):
		return np.array(x, dtype=np.datetime64)

	ratioPlot = list()
	timeAxisStr = []
	dataSource = []

	now = datetime.now()
	
	itemInfos = "Machine 001"
	y = sin(x)
	
	plot = figure(title="Machine 001", x_axis_type="datetime", toolbar_location=None, tools="hover", tooltips="@y")
	plot.background_fill_color = "#efefef"
	plot.xgrid.grid_line_color=None
	plot.xaxis.axis_label = 'Time'
	plot.yaxis.axis_label = 'Value'
	
	line_data = {"dataTime":[],"y":[]}
	line_data['y'].append(y)
	timeAxisStr.append(now.strftime("%Y-%m-%d %H:%M:%S"))
	line_data['dataTime'] = dateTime(timeAxisStr)
	dataSource = ColumnDataSource(data=line_data)
	plot.line(x='dataTime', y= 'y', source=dataSource, color='blue')
	update_xaxis(plot, line_data['dataTime'])
	plot.y_range.start = -1.0
	plot.y_range.end = 1.0

	ratioPlot.append(plot)

	def update_data():
		now = datetime.now()
		global x
		x = x + 0.1
		y = sin(x)
		
		dataSource.data['y'].append(y)
		timeAxisStr.append(now.strftime("%Y-%m-%d %H:%M:%S"))
		dataSource.data['dataTime'] = dateTime(timeAxisStr)
		dataSource.trigger('data', dataSource.data, dataSource.data)
		print("dataSource.data= ", dataSource.data, end = '\n')
		
	grid = gridplot(ratioPlot, ncols=1)
	curdoc().add_root(grid)
	curdoc().add_periodic_callback(update_data, 1000)
	
	return 'end of allMachineEffiencyToday()'

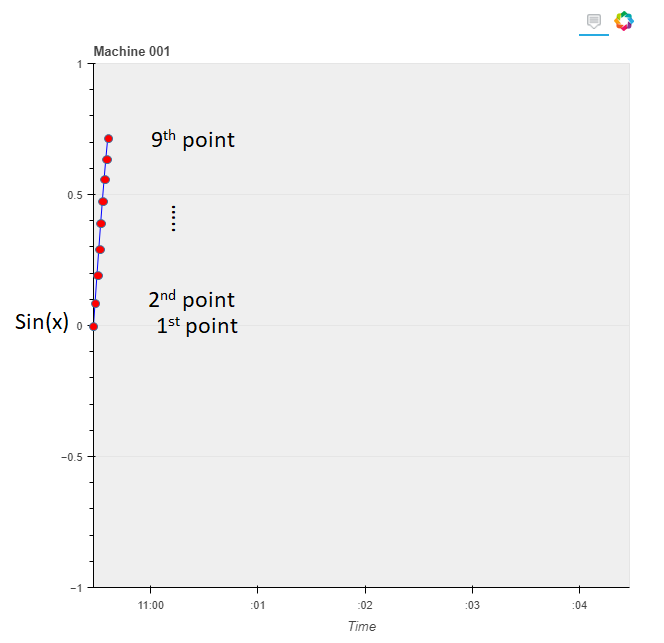
The performance value is refreshed by callfunction every single second .

curdoc().add_periodic_callback(update_data, 1000)

However, the curve of the plot was just refreshed before the ninth callbacks like the following graph, even though the callback function was correctly called at every single second. We can see the “dataSource.data” via “print” function in “update_data()”, all of the data was gotten.

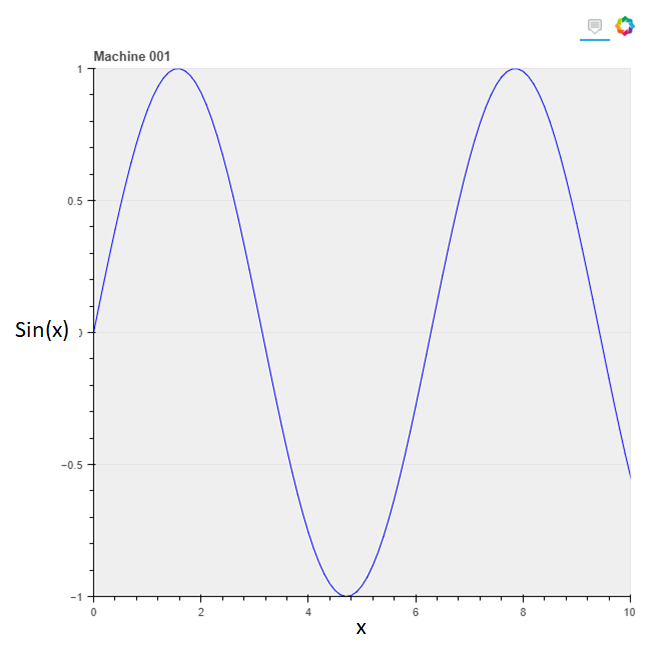
But, if I changed the values of x-axis to be float number, then the curve was changed correctly, all of the points of the line are drawn.

	plot = figure(title="Machine 001", toolbar_location=None, tools="hover", tooltips="@y")
...
	line_data = {"x":[],"y":[]}
	line_data['x'].append(x)
	line_data['y'].append(y)
...
	def update_data():
...		
		dataSource.data['y'].append(y)
		dataSource.data['x'].append(x)

Does any one know what is going on?
Best regard, Thank you.

Hi @yvechang please edit your post to use code formatting so that the code is intelligible (either with the </> icon on the editing toolbar, or triple backtick ``` fences around the code blocks)

And if you want us to be able to run and investigate directly (probably required to figure anything out) please expand the code to be a complete Minimal Reproducible Example

OK. Thank Bryan. I had reedited my question.

@yvechang the script is not complete (it has missing module)

ModuleNotFoundError: No module named 'userRight'

therefore it cannot be run to be investigated directly. All I can suggest is that you might find useful clues in the console log of the Bokeh server and also the JavaScript log of the browser.

@Bryan The console log showed the following message.

[bokeh] data source has columns of inconsistent lengths
get_length	@	bokeh.min.js?v=ada5d…99c5f3062545d11:222
...
Uncaught Error: Size mismatch
    at Object.e.assert (bokeh.min.js?v=ada5d64938a63c435e537bbd83d34dfd3b1da9bfb3ca9c7b8e947f29983f2bd491f6a157b4613e727b5739396d69da58a21a56167d248c5ff99c5f3062545d11:176)
    ...

The mistake didn’t appear any more, and the figure can be updated successfully after I modified two segments of my program about line_data[‘dataTime’]. Thank you very much!

from bokeh.layouts import gridplot, column
from bokeh.models import ColumnDataSource, Div, HoverTool, BoxAnnotation
from bokeh.plotting import curdoc, figure
from userRight import mac_is_valid
import numpy as np
from datetime import datetime, timedelta
from numpy import arange, linspace, pi, sin

x = 0.0
def allMachineEffiencyToday():
	def update_xaxis(plot, timeArray):
		plot.x_range.start = min(timeArray)
		#plot.x_range.end   = datetime.fromtimestamp(((max(timeArray) - np.datetime64('1970-01-01T00:00:00Z') - np.timedelta64(8, 'h')) / np.timedelta64(1, 's')))#先將 datetime64 轉為 timestamp 格式,再轉為 datetime 格式。"- np.timedelta64(8, 'h')" 是為了得到台灣時間
		plot.x_range.end   = max(timeArray)
		if (min(timeArray) == max(timeArray)):
			plot.x_range.end = plot.x_range.end + timedelta(minutes = 5)

	def update_yAxis(plot, valueArray):
		plot.y_range.start = -1.0
		plot.y_range.end = 1.0
		
	def dateTime(x):
		return np.array(x, dtype=np.datetime64)

	ratioPlot = list()
	timeAxisStr = []
	dataSource = []

	now = datetime.now()
	
	itemInfos = "Machine 001"
	y = sin(x)
	
	plot = figure(title="Machine 001", x_axis_type="datetime", toolbar_location=None, tools="hover", tooltips="@y")
	plot.background_fill_color = "#efefef"
	plot.xgrid.grid_line_color=None
	plot.xaxis.axis_label = 'Time'
	plot.yaxis.axis_label = 'Value'
	
	line_data = {"dataTime":[],"y":[]}
	line_data['y'].append(y)
	#timeAxisStr.append(now.strftime("%Y-%m-%d %H:%M:%S"))
	#line_data['dataTime'] = dateTime(timeAxisStr)
	line_data['dataTime'].append(datetime.strptime(now.strftime("%Y-%m-%d %H:%M:%S"), "%Y-%m-%d %H:%M:%S"))
	dataSource = ColumnDataSource(data=line_data)
	plot.line(x='dataTime', y= 'y', source=dataSource, color='blue')
	update_xaxis(plot, line_data['dataTime'])
	plot.y_range.start = -1.0
	plot.y_range.end = 1.0

	ratioPlot.append(plot)

	def update_data():
		now = datetime.now()
		global x
		x = x + 0.1
		y = sin(x)
		
		dataSource.data['y'].append(y)
		#timeAxisStr.append(now.strftime("%Y-%m-%d %H:%M:%S"))
		#dataSource.data['dataTime'] = dateTime(timeAxisStr)
		dataSource.data['dataTime'].append(datetime.strptime(now.strftime("%Y-%m-%d %H:%M:%S"), "%Y-%m-%d %H:%M:%S"))
		dataSource.trigger('data', dataSource.data, dataSource.data)
		
	grid = gridplot(ratioPlot, ncols=1)
	curdoc().add_root(grid)
	curdoc().add_periodic_callback(update_data, 1000)
	
	return 'end of allMachineEffiencyToday()'

This topic was automatically closed 90 days after the last reply. New replies are no longer allowed.