Hello,
I started using Bokeh a few months ago and I´m new to this forum. I stated this question on StackOverflow about the different possibilities to update one column in a CDS and the time it takes to update.
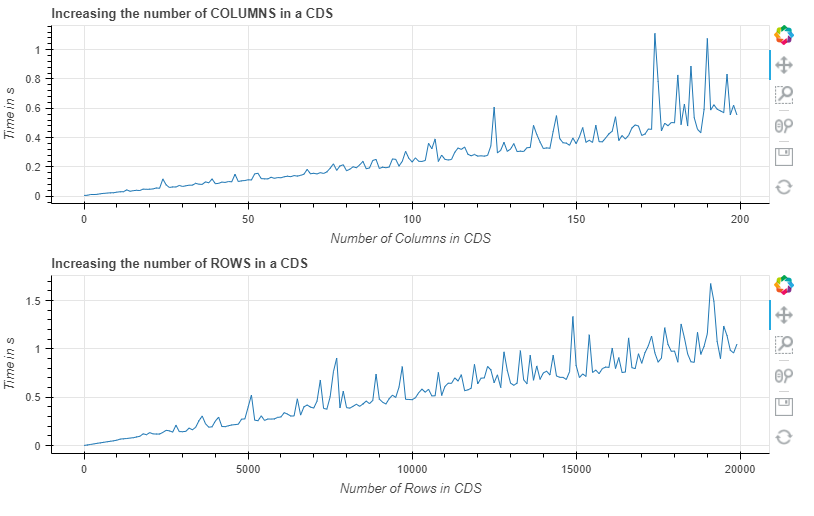
Now I investigated a little bit further and to me it seems, that the time it takes to update one specific column in a CDS actually not only depends on the number of rows of that CDS (which to me would sound very logical), but it also depends on the number of total columns in that CDS. This is something I would not have expected.
The following is a MRE that I made to show this behavior.
#Using Bokeh==2.3.0
import pandas as pd
from bokeh.plotting import figure, curdoc, show
from bokeh.models import ColumnDataSource
from bokeh.layouts import layout
import random
import time
import numpy as np

N_test = 3

times_list_cols = []

def update_data(n_cols, n_rows):
    # Prepare a CDS with some random value:
    df = pd.DataFrame({"Value1": [int(random.random()*10) for i in range(n_rows)]})

    # Add n_cols additional columns with random values
    for i in range(n_cols):
        df[f"col_{i}"] = df[f"Value1"]/i

    # Create actual CDS
    source = ColumnDataSource(df)

    # Update one column and make N_test time measurements
    new_column = source.data["Value1"]+1
    time_needed=[]
    for test_n in range(N_test):
        t0=time.time()
        source.data['Value1'] = new_column
        time_needed.append(time.time() - t0)

    return np.mean(time_needed)

# Check impact of columns and show results
times=[]
N_rows=5000
for n_cols in range(0,200):
    time_needed = update_data(n_cols=n_cols, n_rows=N_rows)
    times.append(time_needed)
    print(f"Time needed for {n_cols} cols and {N_rows} rows: {time_needed}")

plot_rows = figure(plot_width=800, plot_height=250)
plot_rows.line(x=np.arange(0,200), y=times)
plot_rows.yaxis.axis_label = 'Time in s'
plot_rows.xaxis.axis_label = 'Number of Columns in CDS'
plot_rows.title.text = "Increasing the number of COLUMNS in a CDS"

# Check impact of rows and show results
times=[]
N_cols=100
for n_rows in range(0,20000,100):
    time_needed = update_data(n_cols=N_cols, n_rows=n_rows)
    times.append(time_needed)
    print(f"Time needed for {N_cols} cols and {n_rows} rows : {time_needed}")

plot_cols = figure(plot_width=800, plot_height=250)
plot_cols.line(x=np.arange(0,20000,100), y=times)
plot_cols.yaxis.axis_label = 'Time in s'
plot_cols.xaxis.axis_label = 'Number of Rows in CDS'
plot_cols.title.text = "Increasing the number of ROWS in a CDS"

show(layout([[plot_rows],[plot_cols]]))
This results in the following (I know, there are better ways to log the time, but I guess my point of linear increasement becomse clear):
Now my Question is, am I missing something, or is this the correect and intended behavior?
Is there a way to have a fast access/edit regardless of the number of columns?
Thanks for your support and discussion.