Why the plot did not update?

What are you trying to do?

I want to periodically update a plot with the features referred from a psycopg2 database.

What have you tried that did NOT work as expected?


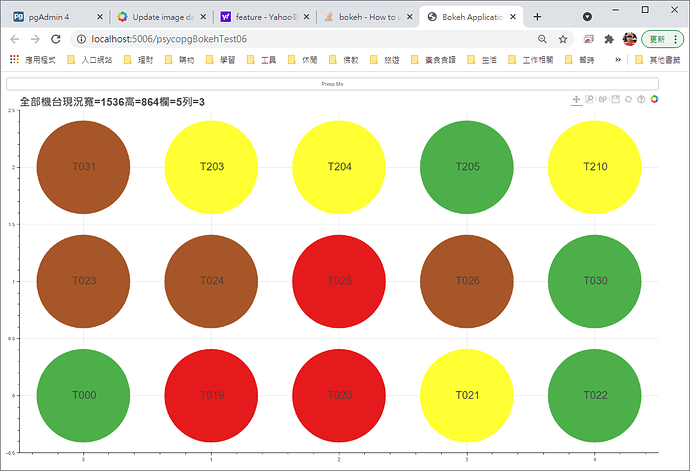
Plot can be showed as above. But the plot is never updated in each second periodically.

@yvechang FYI I’ve deleted the link to the code because the file appeared to leak actual credentials and connection information.

I don’t see anything offhand wrong with the code, but it’s really impossible to know what the state of the database updates is. My suggestion is to start doing what I would do in this situation, which is to add lots of print/logging statements to verify that callbacks are executing when you want them to, that data base connections are actually successful, that in general the program state is what you expect it to. At some point, it won’t be, and that will point the way to what the immediate problem is.

There is a β€œprint” statement in the callback procedure β€œupdate_data()”, and it shows the newest data are collected in the callback procedure.

@yvechang This is the data update:

source.data = dict(x=xs, y=ys, color=colors, label=labels)

Those are the important values, but they are not being printed out in the code you linked earlier. Have you actually looked at those? What about any log or error messages, both in the app console log, and also in the browser’s JS console log?

As an aside, it looks like you are infinitely accumulating Label objects. This is a serious resource leak that will eventually adversely affect performance.

I added a print statement after the for loop just now. The following is the output.
β€œβ€""""""""""""""""""""""""""""""""""""""""""""""""""""
Id= T000 state= 255 x= 0 y= 0
Id= T019 state= 119 x= 1 y= 0
Id= T020 state= 119 x= 2 y= 0
Id= T021 state= 254 x= 3 y= 0
Id= T022 state= 255 x= 4 y= 0
Id= T023 state= 119 x= 0 y= 1
Id= T024 state= 100 x= 1 y= 1
Id= T025 state= 119 x= 2 y= 1
Id= T026 state= 120 x= 3 y= 1
Id= T030 state= 255 x= 4 y= 1
Id= T031 state= 120 x= 0 y= 2
Id= T203 state= 254 x= 1 y= 2
Id= T204 state= 254 x= 2 y= 2
Id= T205 state= 255 x= 3 y= 2
Id= T210 state= 254 x= 4 y= 2
xs= [4, 1, 2, 3, 4, 0, 1, 2, 3, 4, 0, 1, 2, 3, 4]
ys= [2, 0, 0, 0, 0, 1, 1, 1, 1, 1, 2, 2, 2, 2, 2]
colors= [’#ffff33’, β€˜#e41a1c’, β€˜#e41a1c’, β€˜#ffff33’, β€˜#4daf4a’, β€˜#e41a1c’, β€˜#a65628’, β€˜#e41a1c’, β€˜#a65628’, β€˜#4daf4a’, β€˜#a65628’, β€˜#ffff33’, β€˜#ffff33’, β€˜#4daf4a’, β€˜#ffff33’]
labels= [Label(id=β€˜2202’, …), Label(id=β€˜1003’, …), Label(id=β€˜1004’, …), Label(id=β€˜1005’, …), Label(id=β€˜1006’, …), Label(id=β€˜1007’, …), Label(id=β€˜1008’, …), Label(id=β€˜1009’, …), Label(id=β€˜1010’, …), Label(id=β€˜1011’, …), Label(id=β€˜1012’, …), Label(id=β€˜1013’, …), Label(id=β€˜1014’, …), Label(id=β€˜1015’, …), Label(id=β€˜1016’, …)]
β€œβ€""""""""""""""""""""""""""""""""""""""""""""""""""""

Are those values actually changing iteration to iteration? What about console or browser log messages?

The output above is just after an iteration. The following output was caught after I change the value of state form 0 to 119 in the record β€œId= T023”. We can see that state value printed was changed. However, the 6th color didn’t be changed! The if statements seems not actually worked!
β€˜β€™β€™β€™β€™β€™β€™β€™β€™β€™β€™β€™β€™β€™β€™β€™β€™β€™β€™β€™β€™β€™β€™β€™β€™β€™β€™β€™β€™β€™β€™β€™β€™β€™β€™β€™β€™β€™β€™β€™β€™β€™β€™β€™β€™β€™β€™β€™β€™β€™β€™β€™β€™β€™β€™β€™β€™β€™β€™β€™β€™β€™β€™β€™β€™β€™β€™β€™β€™β€™β€™β€™β€™β€™β€™β€™β€™β€™β€™β€™β€™β€™β€™β€™β€™
Id= T000 state= 255 x= 0 y= 0
Id= T019 state= 119 x= 1 y= 0
Id= T020 state= 119 x= 2 y= 0
Id= T021 state= 254 x= 3 y= 0
Id= T022 state= 255 x= 4 y= 0
Id= T023 state= 119 x= 0 y= 1
Id= T024 state= 100 x= 1 y= 1
Id= T025 state= 119 x= 2 y= 1
Id= T026 state= 120 x= 3 y= 1
Id= T030 state= 255 x= 4 y= 1
Id= T031 state= 120 x= 0 y= 2
Id= T203 state= 254 x= 1 y= 2
Id= T204 state= 254 x= 2 y= 2
Id= T205 state= 255 x= 3 y= 2
Id= T210 state= 254 x= 4 y= 2
xs= [4, 1, 2, 3, 4, 0, 1, 2, 3, 4, 0, 1, 2, 3, 4]
ys= [2, 0, 0, 0, 0, 1, 1, 1, 1, 1, 2, 2, 2, 2, 2]
colors= [’#ffff33’, β€˜#e41a1c’, β€˜#e41a1c’, β€˜#ffff33’, β€˜#4daf4a’, β€˜#e41a1c’, β€˜#a65628’, β€˜#e41a1c’, β€˜#a65628’, β€˜#4daf4a’, β€˜#a65628’, β€˜#ffff33’, β€˜#ffff33’, β€˜#4daf4a’, β€˜#ffff33’]
labels= [Label(id=β€˜1530’, …), Label(id=β€˜1003’, …), Label(id=β€˜1004’, …), Label(id=β€˜1005’, …), Label(id=β€˜1006’, …), Label(id=β€˜1007’, …), Label(id=β€˜1008’, …), Label(id=β€˜1009’, …), Label(id=β€˜1010’, …), Label(id=β€˜1011’, …), Label(id=β€˜1012’, …), Label(id=β€˜1013’, …), Label(id=β€˜1014’, …), Label(id=β€˜1015’, …), Label(id=β€˜1016’, …)]

β€˜β€™β€™β€™β€™β€™β€™β€™β€™β€™β€™β€™β€™β€™β€™β€™β€™β€™β€™β€™β€™β€™β€™β€™β€™β€™β€™β€™β€™β€™β€™β€™β€™β€™β€™β€™β€™β€™β€™β€™β€™β€™β€™β€™β€™β€™β€™β€™β€™β€™β€™β€™β€™β€™β€™β€™β€™β€™β€™β€™β€™β€™β€™β€™β€™β€™β€™β€™β€™β€™β€™β€™β€™β€™β€™β€™β€™β€™β€™β€™β€™β€™β€™β€™β€™
Id= T000 state= 255 x= 0 y= 0
Id= T019 state= 119 x= 1 y= 0
Id= T020 state= 119 x= 2 y= 0
Id= T021 state= 254 x= 3 y= 0
Id= T022 state= 255 x= 4 y= 0
Id= T023 state= 0 x= 0 y= 1
Id= T024 state= 100 x= 1 y= 1
Id= T025 state= 119 x= 2 y= 1
Id= T026 state= 120 x= 3 y= 1
Id= T030 state= 255 x= 4 y= 1
Id= T031 state= 120 x= 0 y= 2
Id= T203 state= 254 x= 1 y= 2
Id= T204 state= 254 x= 2 y= 2
Id= T205 state= 255 x= 3 y= 2
Id= T210 state= 254 x= 4 y= 2
xs= [4, 1, 2, 3, 4, 0, 1, 2, 3, 4, 0, 1, 2, 3, 4]
ys= [2, 0, 0, 0, 0, 1, 1, 1, 1, 1, 2, 2, 2, 2, 2]
colors= [’#ffff33’, β€˜#e41a1c’, β€˜#e41a1c’, β€˜#ffff33’, β€˜#4daf4a’, β€˜#e41a1c’, β€˜#a65628’, β€˜#e41a1c’, β€˜#a65628’, β€˜#4daf4a’, β€˜#a65628’, β€˜#ffff33’, β€˜#ffff33’, β€˜#4daf4a’, β€˜#ffff33’]
labels= [Label(id=β€˜1546’, …), Label(id=β€˜1003’, …), Label(id=β€˜1004’, …), Label(id=β€˜1005’, …), Label(id=β€˜1006’, …), Label(id=β€˜1007’, …), Label(id=β€˜1008’, …), Label(id=β€˜1009’, …), Label(id=β€˜1010’, …), Label(id=β€˜1011’, …), Label(id=β€˜1012’, …), Label(id=β€˜1013’, …), Label(id=β€˜1014’, …), Label(id=β€˜1015’, …), Label(id=β€˜1016’, …)]

I am sorry for miss adding the statement β€œi = i + 1” in the end of the for loop. The following output is really the expected. We can see that the 6th state value and the 6th color were changed! But why did the plot still not changed?


Id= T000 state= 255 x= 0 y= 0
Id= T019 state= 119 x= 1 y= 0
Id= T020 state= 119 x= 2 y= 0
Id= T021 state= 254 x= 3 y= 0
Id= T022 state= 255 x= 4 y= 0
Id= T023 state= 0 x= 0 y= 1
Id= T024 state= 100 x= 1 y= 1
Id= T025 state= 0 x= 2 y= 1
Id= T026 state= 120 x= 3 y= 1
Id= T030 state= 255 x= 4 y= 1
Id= T031 state= 120 x= 0 y= 2
Id= T203 state= 254 x= 1 y= 2
Id= T204 state= 254 x= 2 y= 2
Id= T205 state= 255 x= 3 y= 2
Id= T210 state= 254 x= 4 y= 2
xs= [0, 1, 2, 3, 4, 0, 1, 2, 3, 4, 0, 1, 2, 3, 4]
ys= [0, 0, 0, 0, 0, 1, 1, 1, 1, 1, 2, 2, 2, 2, 2]
colors= [’#4daf4a’, β€˜#e41a1c’, β€˜#e41a1c’, β€˜#ffff33’, β€˜#4daf4a’, β€˜#a65628’, β€˜#a65628’, β€˜#a65628’, β€˜#a65628’, β€˜#4daf4a’, β€˜#a65628’, β€˜#ffff33’, β€˜#ffff33’, β€˜#4daf4a’, β€˜#ffff33’]
labels= [Label(id=β€˜1404’, …), Label(id=β€˜1405’, …), Label(id=β€˜1406’, …), Label(id=β€˜1407’, …), Label(id=β€˜1408’, …), Label(id=β€˜1409’, …), Label(id=β€˜1410’, …), Label(id=β€˜1411’, …), Label(id=β€˜1412’, …), Label(id=β€˜1413’, …), Label(id=β€˜1414’, …), Label(id=β€˜1415’, …), Label(id=β€˜1416’, …), Label(id=β€˜1417’, …), Label(id=β€˜1418’, …)]
Id= T000 state= 255 x= 0 y= 0
Id= T019 state= 119 x= 1 y= 0
Id= T020 state= 119 x= 2 y= 0
Id= T021 state= 254 x= 3 y= 0
Id= T022 state= 255 x= 4 y= 0
Id= T023 state= 119 x= 0 y= 1
Id= T024 state= 100 x= 1 y= 1
Id= T025 state= 0 x= 2 y= 1
Id= T026 state= 120 x= 3 y= 1
Id= T030 state= 255 x= 4 y= 1
Id= T031 state= 120 x= 0 y= 2
Id= T203 state= 254 x= 1 y= 2
Id= T204 state= 254 x= 2 y= 2
Id= T205 state= 255 x= 3 y= 2
Id= T210 state= 254 x= 4 y= 2
xs= [0, 1, 2, 3, 4, 0, 1, 2, 3, 4, 0, 1, 2, 3, 4]
ys= [0, 0, 0, 0, 0, 1, 1, 1, 1, 1, 2, 2, 2, 2, 2]
colors= [’#4daf4a’, β€˜#e41a1c’, β€˜#e41a1c’, β€˜#ffff33’, β€˜#4daf4a’, β€˜#e41a1c’, β€˜#a65628’, β€˜#a65628’, β€˜#a65628’, β€˜#4daf4a’, β€˜#a65628’, β€˜#ffff33’, β€˜#ffff33’, β€˜#4daf4a’, β€˜#ffff33’]
labels= [Label(id=β€˜1420’, …), Label(id=β€˜1421’, …), Label(id=β€˜1422’, …), Label(id=β€˜1423’, …), Label(id=β€˜1424’, …), Label(id=β€˜1425’, …), Label(id=β€˜1426’, …), Label(id=β€˜1427’, …), Label(id=β€˜1428’, …), Label(id=β€˜1429’, …), Label(id=β€˜1430’, …), Label(id=β€˜1431’, …), Label(id=β€˜1432’, …), Label(id=β€˜1433’, …), Label(id=β€˜1434’, …)]


@yvechang I’ve asked three times now: what is in the browser’s JS console log? And what is in the terminal log where the bokeh serve process was started? I can’t speculate further without that information.

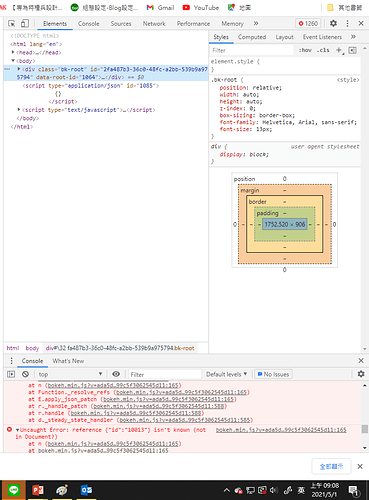
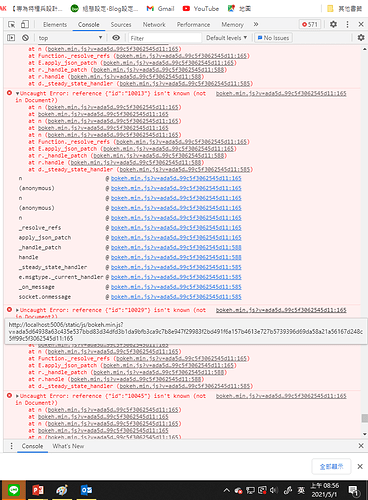
There is no error message in the app console. However there are error message in browser’s JS console.


Since I am not really familiar with β€œbrowser’s JS console,” I can not realize what these errors mean.

That error indicates that BokehJS has been asked to do something with a Bokeh object that it doesn’t know anything about. My suspicion is that it might be to do with the Label that you create every callback, but then don’t actually do anything with. I can’t ever think of a reason to create β€œdangling” objects like this that don’t get added to the document. My first suggestion is to comment that line out in the callback. Then, as I mentioned, the the proper way to do things is to create one Label, up front, then later only modify the data source for that existing label, to update it.

Hi Bryan,
Thank you very much for your suggestions!
From the reminder of your suspicion, Finally, I found the successful way to periodically update the circles and labels in a figure object. And the following things were the changes in my codes.

  1. Remove the label object from the ColumnDataSource of circles in the figure.
  2. Constructing another new ColumnDataSource() named β€œlabelSource” for a β€œlabels” object.
  3. Constructing β€œlabels” object by LabelSet(…), and assigning source = labelSource.
  4. plot.add_layout(labels).
  5. Update the attributes of both circels and β€œlabels” in the callback function periodically.
1 Like