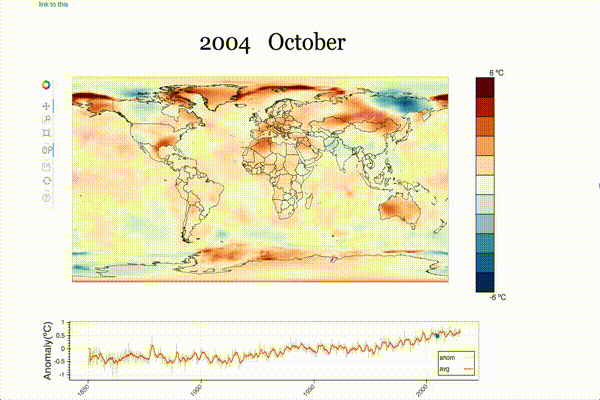
Is it possible to create a global latitude/longitude plot like the one below with Bokeh?
I have data that have time/latitude/longitude dimensions and I’d like to slide/scroll though time to look at the latitude/longitude map corresponding to each time step.
Thanks, Christine. That is exactly what I’m looking for.
In working through your tutorial running the latest version of Bokeh (0.11.1), the animation failed because bokeh.plotting.cursession no longer exists. Is there an easy work around for this, or am I better off installing an older version of bokeh?
(I’ve raised an issue on GitHub in case this is something best discussed off-list: Newer Bokeh releases · Issue #7 · chdoig/scipy2015-blaze-bokeh · GitHub)
···
On Thursday, June 16, 2016 at 12:48:38 AM UTC+10, Christine Doig wrote:
You're definitely not better off installing an older version of Bokeh. The old bokeh-server never really made it past experimental prototype stage. It is completely deprecated and unsupported, and the new server surpasses it in every possible measure (performance, scalability, ease-of-use, and reliability).
Have you tried out / studied some of the simplest bokeh server examples, e.g.:
yet? In principal, the app you describe would be extremely similar to that one, only instead up of updating the data for a line glyph in a slider callback, you'd update the data for your image glyph.
Thanks,
Bryan
···
On Jun 15, 2016, at 10:23 PM, Damien Irving <[email protected]> wrote:
Thanks, Christine. That is exactly what I'm looking for.
In working through your tutorial running the latest version of Bokeh (0.11.1), the animation failed because bokeh.plotting.cursession no longer exists. Is there an easy work around for this, or am I better off installing an older version of bokeh?
(I've raised an issue on GitHub in case this is something best discussed off-list: Issues · chdoig/scipy2015-blaze-bokeh · GitHub)
On Thursday, June 16, 2016 at 12:48:38 AM UTC+10, Christine Doig wrote:
Hi Irving,