wrong plot with datetime

Hello,

I came across a weird issue with the current bokeh (0.12.13).

I make a simple lineplot with datetime -values on the x axis and normal floats on the y axis.

The x-axis has x_axis_type = ‘datetime’ set.

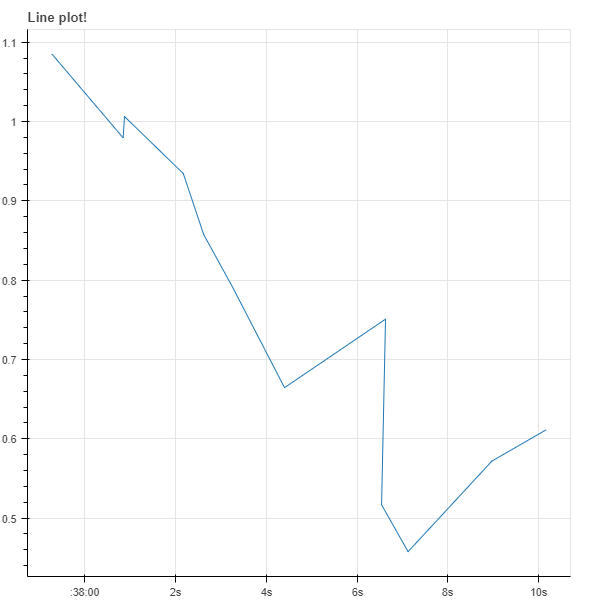
It looks mostly as I expect, but some of the datapoints end up plotted at the wrong location, they are shifted in x.

See this example, I ran it in the notebook and also tried on the server, both yield same result.

from bokeh.plotting import figure, ColumnDataSource
from bokeh.io import output_notebook, show
import datetime
output_notebook()
s = ColumnDataSource(data={‘time’: [datetime.datetime(2018, 1, 3, 15, 37, 59, 141181), datetime.datetime(2018, 1, 3, 15, 37, 59, 922452), datetime.datetime(2018, 1, 3, 15, 38, 0, 437795), datetime.datetime(2018, 1, 3, 15, 38, 2, 85017), datetime.datetime(2018, 1, 3, 15, 38, 2, 309374), datetime.datetime(2018, 1, 3, 15, 38, 3, 126897), datetime.datetime(2018, 1, 3, 15, 38, 4, 199958), datetime.datetime(2018, 1, 3, 15, 38, 5, 812119), datetime.datetime(2018, 1, 3, 15, 38, 6, 268737), datetime.datetime(2018, 1, 3, 15, 38, 7, 60761), datetime.datetime(2018, 1, 3, 15, 38, 7, 983785), datetime.datetime(2018, 1, 3, 15, 38, 9, 577450)], ‘price’: [1.0847629513523207, 0.9794848855621339, 1.0063434715784794, 0.9344615630521793, 0.8576388875411332, 0.7913181857377759, 0.6643866153150308, 0.7508273082922711, 0.5165949372573422, 0.4575801368474404, 0.5717795135819855, 0.6109869562417782]})
fig = figure(title=‘Line plot!’, x_axis_type=‘datetime’)
fig.line(x=‘time’, y=‘price’, source=s)
show(fig)

``

When you look at the second datapoint (at x = datetime.datetime(2018, 1, 3, 15, 37, 59, 922452)), it clearly did not end up there.

There are possibly all datapoints on the wrong spot. The y-values seem to be ok though.

Now am I doing s.th. wrong here?

Is this a bug?

Any hints appreciated,

Daniel.

testplot.ipynb (31.2 KB)

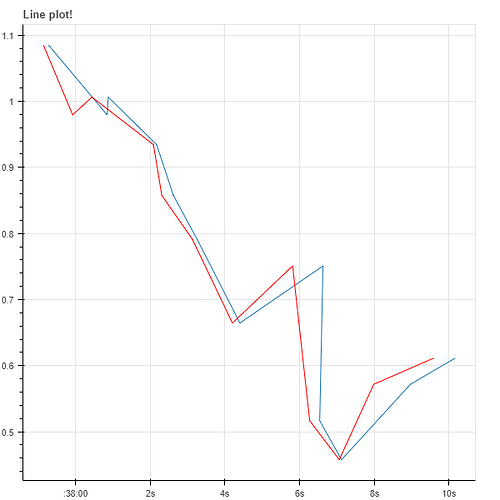
Interestingly, there seems to be something wrong in the conversion of datetimes.
If I do convert them manually with datetime.timestamp(), I do get the correct plot (red line)

See this example and attached image:

data={‘time’: [datetime.datetime(2018, 1, 3, 15, 37, 59, 141181), datetime.datetime(2018, 1, 3, 15, 37, 59, 922452), datetime.datetime(2018, 1, 3, 15, 38, 0, 437795), datetime.datetime(2018, 1, 3, 15, 38, 2, 85017), datetime.datetime(2018, 1, 3, 15, 38, 2, 309374), datetime.datetime(2018, 1, 3, 15, 38, 3, 126897), datetime.datetime(2018, 1, 3, 15, 38, 4, 199958), datetime.datetime(2018, 1, 3, 15, 38, 5, 812119), datetime.datetime(2018, 1, 3, 15, 38, 6, 268737), datetime.datetime(2018, 1, 3, 15, 38, 7, 60761), datetime.datetime(2018, 1, 3, 15, 38, 7, 983785), datetime.datetime(2018, 1, 3, 15, 38, 9, 577450)], ‘price’: [1.0847629513523207, 0.9794848855621339, 1.0063434715784794, 0.9344615630521793, 0.8576388875411332, 0.7913181857377759, 0.6643866153150308, 0.7508273082922711, 0.5165949372573422, 0.4575801368474404, 0.5717795135819855, 0.6109869562417782]}

xx = [(x.timestamp()+3600)*1000 for x in data[‘time’]]
fig = figure(title=‘Line plot!’, x_axis_type=‘datetime’)

fig.line(x=data[‘time’], y=data[‘price’])
fig.line(x=xx,y=data[‘price’],color = ‘red’)
show(fig)

``

I found bug #6680 that might be related datetime (convert_datetime_type) seems to add in extra milliseconds · Issue #6680 · bokeh/bokeh · GitHub

Daniel.

···

Am Mittwoch, 3. Januar 2018 17:26:23 UTC+1 schrieb Daniel W:

Hello,

I came across a weird issue with the current bokeh (0.12.13).

I make a simple lineplot with datetime -values on the x axis and normal floats on the y axis.

The x-axis has x_axis_type = ‘datetime’ set.

It looks mostly as I expect, but some of the datapoints end up plotted at the wrong location, they are shifted in x.

See this example, I ran it in the notebook and also tried on the server, both yield same result.

from bokeh.plotting import figure, ColumnDataSource
from bokeh.io import output_notebook, show
import datetime
output_notebook()
s = ColumnDataSource(data={‘time’: [datetime.datetime(2018, 1, 3, 15, 37, 59, 141181), datetime.datetime(2018, 1, 3, 15, 37, 59, 922452), datetime.datetime(2018, 1, 3, 15, 38, 0, 437795), datetime.datetime(2018, 1, 3, 15, 38, 2, 85017), datetime.datetime(2018, 1, 3, 15, 38, 2, 309374), datetime.datetime(2018, 1, 3, 15, 38, 3, 126897), datetime.datetime(2018, 1, 3, 15, 38, 4, 199958), datetime.datetime(2018, 1, 3, 15, 38, 5, 812119), datetime.datetime(2018, 1, 3, 15, 38, 6, 268737), datetime.datetime(2018, 1, 3, 15, 38, 7, 60761), datetime.datetime(2018, 1, 3, 15, 38, 7, 983785), datetime.datetime(2018, 1, 3, 15, 38, 9, 577450)], ‘price’: [1.0847629513523207, 0.9794848855621339, 1.0063434715784794, 0.9344615630521793, 0.8576388875411332, 0.7913181857377759, 0.6643866153150308, 0.7508273082922711, 0.5165949372573422, 0.4575801368474404, 0.5717795135819855, 0.6109869562417782]})
fig = figure(title=‘Line plot!’, x_axis_type=‘datetime’)
fig.line(x=‘time’, y=‘price’, source=s)
show(fig)

``

When you look at the second datapoint (at x = datetime.datetime(2018, 1, 3, 15, 37, 59, 922452)), it clearly did not end up there.

There are possibly all datapoints on the wrong spot. The y-values seem to be ok though.

Now am I doing s.th. wrong here?

Is this a bug?

Any hints appreciated,

Daniel.

Hi,

I believe that issue is the same. For some reason it never got triaged, so it has been overlooked. I have added appropriate tags and a milestone. It would be helpful if you could reply to the issue to link this mailing list discussion as well.

Thanks,

Bryan

···

On Jan 3, 2018, at 14:52, Daniel W <[email protected]> wrote:

Interestingly, there seems to be something wrong in the conversion of datetimes.
If I do convert them manually with datetime.timestamp(), I do get the correct plot (red line)
See this example and attached image:

data={'time': [datetime.datetime(2018, 1, 3, 15, 37, 59, 141181), datetime.datetime(2018, 1, 3, 15, 37, 59,922452), datetime.datetime(2018, 1, 3, 15, 38, 0, 437795), datetime.datetime(2018, 1, 3, 15, 38, 2, 85017),datetime.datetime(2018, 1, 3, 15, 38, 2, 309374), datetime.datetime(2018, 1, 3, 15, 38, 3, 126897),datetime.datetime(2018, 1, 3, 15, 38, 4, 199958), datetime.datetime(2018, 1, 3, 15, 38, 5, 812119),datetime.datetime(2018, 1, 3, 15, 38, 6, 268737), datetime.datetime(2018, 1, 3, 15, 38, 7, 60761),datetime.datetime(2018, 1, 3, 15, 38, 7, 983785), datetime.datetime(2018, 1, 3, 15, 38, 9, 577450)], 'price':[1.0847629513523207, 0.9794848855621339, 1.0063434715784794, 0.9344615630521793, 0.8576388875411332,0.7913181857377759, 0.6643866153150308, 0.7508273082922711, 0.5165949372573422, 0.4575801368474404,0.5717795135819855, 0.6109869562417782]}

xx = [(x.timestamp()+3600)*1000 for x in data['time']]
fig = figure(title='Line plot!', x_axis_type='datetime')

fig.line(x=data['time'], y=data['price'])
fig.line(x=xx,y=data['price'],color = 'red')
show(fig)

I found bug #6680 that might be related datetime (convert_datetime_type) seems to add in extra milliseconds · Issue #6680 · bokeh/bokeh · GitHub

Daniel.

Am Mittwoch, 3. Januar 2018 17:26:23 UTC+1 schrieb Daniel W:
Hello,

I came across a weird issue with the current bokeh (0.12.13).
I make a simple lineplot with datetime -values on the x axis and normal floats on the y axis.
The x-axis has x_axis_type = 'datetime' set.
It looks mostly as I expect, but some of the datapoints end up plotted at the wrong location, they are shifted in x.
See this example, I ran it in the notebook and also tried on the server, both yield same result.

from bokeh.plotting import figure, ColumnDataSource
from bokeh.io import output_notebook, show
import datetime
output_notebook()
s = ColumnDataSource(data={'time': [datetime.datetime(2018, 1, 3, 15, 37, 59, 141181), datetime.datetime(2018,1, 3, 15, 37, 59, 922452), datetime.datetime(2018, 1, 3, 15, 38, 0, 437795), datetime.datetime(2018, 1, 3, 15,38, 2, 85017), datetime.datetime(2018, 1, 3, 15, 38, 2, 309374), datetime.datetime(2018, 1, 3, 15, 38, 3,126897), datetime.datetime(2018, 1, 3, 15, 38, 4, 199958), datetime.datetime(2018, 1, 3, 15, 38, 5, 812119),datetime.datetime(2018, 1, 3, 15, 38, 6, 268737), datetime.datetime(2018, 1, 3, 15, 38, 7, 60761),datetime.datetime(2018, 1, 3, 15, 38, 7, 983785), datetime.datetime(2018, 1, 3, 15, 38, 9, 577450)], 'price':[1.0847629513523207, 0.9794848855621339, 1.0063434715784794, 0.9344615630521793, 0.8576388875411332,0.7913181857377759, 0.6643866153150308, 0.7508273082922711, 0.5165949372573422, 0.4575801368474404,0.5717795135819855, 0.6109869562417782]})
fig = figure(title='Line plot!', x_axis_type='datetime')
fig.line(x='time', y='price', source=s)
show(fig)

When you look at the second datapoint (at x = datetime.datetime(2018, 1, 3, 15, 37, 59, 922452)), it clearly did not end up there.
There are possibly all datapoints on the wrong spot. The y-values seem to be ok though.

Now am I doing s.th. wrong here?
Is this a bug?

Any hints appreciated,

Daniel.

--
You received this message because you are subscribed to the Google Groups "Bokeh Discussion - Public" group.
To unsubscribe from this group and stop receiving emails from it, send an email to [email protected].
To post to this group, send email to [email protected].
To view this discussion on the web visit https://groups.google.com/a/continuum.io/d/msgid/bokeh/356cb973-fab9-4143-bc12-e362f046fc3e%40continuum.io\.
For more options, visit https://groups.google.com/a/continuum.io/d/optout\.
<bokeh_plot (1).png>
This is fixed in the following PR:

  https://github.com/bokeh/bokeh/pull/7366

Thanks,

Bryan

···

On Jan 3, 2018, at 14:58, Bryan Van de ven <[email protected]> wrote:

Hi,

I believe that issue is the same. For some reason it never got triaged, so it has been overlooked. I have added appropriate tags and a milestone. It would be helpful if you could reply to the issue to link this mailing list discussion as well.

Thanks,

Bryan

On Jan 3, 2018, at 14:52, Daniel W <[email protected]> wrote:

Interestingly, there seems to be something wrong in the conversion of datetimes.
If I do convert them manually with datetime.timestamp(), I do get the correct plot (red line)
See this example and attached image:

data={'time': [datetime.datetime(2018, 1, 3, 15, 37, 59, 141181), datetime.datetime(2018, 1, 3, 15, 37, 59,922452), datetime.datetime(2018, 1, 3, 15, 38, 0, 437795), datetime.datetime(2018, 1, 3, 15, 38, 2, 85017),datetime.datetime(2018, 1, 3, 15, 38, 2, 309374), datetime.datetime(2018, 1, 3, 15, 38, 3, 126897),datetime.datetime(2018, 1, 3, 15, 38, 4, 199958), datetime.datetime(2018, 1, 3, 15, 38, 5, 812119),datetime.datetime(2018, 1, 3, 15, 38, 6, 268737), datetime.datetime(2018, 1, 3, 15, 38, 7, 60761),datetime.datetime(2018, 1, 3, 15, 38, 7, 983785), datetime.datetime(2018, 1, 3, 15, 38, 9, 577450)], 'price':[1.0847629513523207, 0.9794848855621339, 1.0063434715784794, 0.9344615630521793, 0.8576388875411332,0.7913181857377759, 0.6643866153150308, 0.7508273082922711, 0.5165949372573422, 0.4575801368474404,0.5717795135819855, 0.6109869562417782]}

xx = [(x.timestamp()+3600)*1000 for x in data['time']]
fig = figure(title='Line plot!', x_axis_type='datetime')

fig.line(x=data['time'], y=data['price'])
fig.line(x=xx,y=data['price'],color = 'red')
show(fig)

I found bug #6680 that might be related datetime (convert_datetime_type) seems to add in extra milliseconds · Issue #6680 · bokeh/bokeh · GitHub

Daniel.

Am Mittwoch, 3. Januar 2018 17:26:23 UTC+1 schrieb Daniel W:
Hello,

I came across a weird issue with the current bokeh (0.12.13).
I make a simple lineplot with datetime -values on the x axis and normal floats on the y axis.
The x-axis has x_axis_type = 'datetime' set.
It looks mostly as I expect, but some of the datapoints end up plotted at the wrong location, they are shifted in x.
See this example, I ran it in the notebook and also tried on the server, both yield same result.

from bokeh.plotting import figure, ColumnDataSource
from bokeh.io import output_notebook, show
import datetime
output_notebook()
s = ColumnDataSource(data={'time': [datetime.datetime(2018, 1, 3, 15, 37, 59, 141181), datetime.datetime(2018,1, 3, 15, 37, 59, 922452), datetime.datetime(2018, 1, 3, 15, 38, 0, 437795), datetime.datetime(2018, 1, 3, 15,38, 2, 85017), datetime.datetime(2018, 1, 3, 15, 38, 2, 309374), datetime.datetime(2018, 1, 3, 15, 38, 3,126897), datetime.datetime(2018, 1, 3, 15, 38, 4, 199958), datetime.datetime(2018, 1, 3, 15, 38, 5, 812119),datetime.datetime(2018, 1, 3, 15, 38, 6, 268737), datetime.datetime(2018, 1, 3, 15, 38, 7, 60761),datetime.datetime(2018, 1, 3, 15, 38, 7, 983785), datetime.datetime(2018, 1, 3, 15, 38, 9, 577450)], 'price':[1.0847629513523207, 0.9794848855621339, 1.0063434715784794, 0.9344615630521793, 0.8576388875411332,0.7913181857377759, 0.6643866153150308, 0.7508273082922711, 0.5165949372573422, 0.4575801368474404,0.5717795135819855, 0.6109869562417782]})
fig = figure(title='Line plot!', x_axis_type='datetime')
fig.line(x='time', y='price', source=s)
show(fig)

When you look at the second datapoint (at x = datetime.datetime(2018, 1, 3, 15, 37, 59, 922452)), it clearly did not end up there.
There are possibly all datapoints on the wrong spot. The y-values seem to be ok though.

Now am I doing s.th. wrong here?
Is this a bug?

Any hints appreciated,

Daniel.

--
You received this message because you are subscribed to the Google Groups "Bokeh Discussion - Public" group.
To unsubscribe from this group and stop receiving emails from it, send an email to [email protected].
To post to this group, send email to [email protected].
To view this discussion on the web visit https://groups.google.com/a/continuum.io/d/msgid/bokeh/356cb973-fab9-4143-bc12-e362f046fc3e%40continuum.io\.
For more options, visit https://groups.google.com/a/continuum.io/d/optout\.
<bokeh_plot (1).png>

Hi Bryan,

wel that was fast. :slight_smile: Thank you.

I will test this then with the next release.

···

Am Donnerstag, 4. Januar 2018 00:02:52 UTC+1 schrieb Bryan Van de ven:

This is fixed in the following PR:

    [https://github.com/bokeh/bokeh/pull/7366](https://github.com/bokeh/bokeh/pull/7366)

Thanks,

Bryan

On Jan 3, 2018, at 14:58, Bryan Van de ven [email protected] wrote:

Hi,

I believe that issue is the same. For some reason it never got triaged, so it has been overlooked. I have added appropriate tags and a milestone. It would be helpful if you could reply to the issue to link this mailing list discussion as well.

Thanks,

Bryan

On Jan 3, 2018, at 14:52, Daniel W [email protected] wrote:

Interestingly, there seems to be something wrong in the conversion of datetimes.

If I do convert them manually with datetime.timestamp(), I do get the correct plot (red line)

See this example and attached image:

data={‘time’: [datetime.datetime(2018, 1, 3, 15, 37, 59, 141181), datetime.datetime(2018, 1, 3, 15, 37, 59,922452), datetime.datetime(2018, 1, 3, 15, 38, 0, 437795), datetime.datetime(2018, 1, 3, 15, 38, 2, 85017),datetime.datetime(2018, 1, 3, 15, 38, 2, 309374), datetime.datetime(2018, 1, 3, 15, 38, 3, 126897),datetime.datetime(2018, 1, 3, 15, 38, 4, 199958), datetime.datetime(2018, 1, 3, 15, 38, 5, 812119),datetime.datetime(2018, 1, 3, 15, 38, 6, 268737), datetime.datetime(2018, 1, 3, 15, 38, 7, 60761),datetime.datetime(2018, 1, 3, 15, 38, 7, 983785), datetime.datetime(2018, 1, 3, 15, 38, 9, 577450)], ‘price’:[1.0847629513523207, 0.9794848855621339, 1.0063434715784794, 0.9344615630521793, 0.8576388875411332,0.7913181857377759, 0.6643866153150308, 0.7508273082922711, 0.5165949372573422, 0.4575801368474404,0.5717795135819855, 0.6109869562417782]}

xx = [(x.timestamp()+3600)*1000 for x in data[‘time’]]

fig = figure(title=‘Line plot!’, x_axis_type=‘datetime’)

fig.line(x=data[‘time’], y=data[‘price’])

fig.line(x=xx,y=data[‘price’],color = ‘red’)

show(fig)

I found bug #6680 that might be related https://github.com/bokeh/bokeh/issues/6680

Daniel.

Am Mittwoch, 3. Januar 2018 17:26:23 UTC+1 schrieb Daniel W:

Hello,

I came across a weird issue with the current bokeh (0.12.13).

I make a simple lineplot with datetime -values on the x axis and normal floats on the y axis.

The x-axis has x_axis_type = ‘datetime’ set.

It looks mostly as I expect, but some of the datapoints end up plotted at the wrong location, they are shifted in x.

See this example, I ran it in the notebook and also tried on the server, both yield same result.

from bokeh.plotting import figure, ColumnDataSource

from bokeh.io import output_notebook, show

import datetime

output_notebook()

s = ColumnDataSource(data={‘time’: [datetime.datetime(2018, 1, 3, 15, 37, 59, 141181), datetime.datetime(2018,1, 3, 15, 37, 59, 922452), datetime.datetime(2018, 1, 3, 15, 38, 0, 437795), datetime.datetime(2018, 1, 3, 15,38, 2, 85017), datetime.datetime(2018, 1, 3, 15, 38, 2, 309374), datetime.datetime(2018, 1, 3, 15, 38, 3,126897), datetime.datetime(2018, 1, 3, 15, 38, 4, 199958), datetime.datetime(2018, 1, 3, 15, 38, 5, 812119),datetime.datetime(2018, 1, 3, 15, 38, 6, 268737), datetime.datetime(2018, 1, 3, 15, 38, 7, 60761),datetime.datetime(2018, 1, 3, 15, 38, 7, 983785), datetime.datetime(2018, 1, 3, 15, 38, 9, 577450)], ‘price’:[1.0847629513523207, 0.9794848855621339, 1.0063434715784794, 0.9344615630521793, 0.8576388875411332,0.7913181857377759, 0.6643866153150308, 0.7508273082922711, 0.5165949372573422, 0.4575801368474404,0.5717795135819855, 0.6109869562417782]})

fig = figure(title=‘Line plot!’, x_axis_type=‘datetime’)

fig.line(x=‘time’, y=‘price’, source=s)

show(fig)

When you look at the second datapoint (at x = datetime.datetime(2018, 1, 3, 15, 37, 59, 922452)), it clearly did not end up there.

There are possibly all datapoints on the wrong spot. The y-values seem to be ok though.

Now am I doing s.th. wrong here?
Is this a bug?

Any hints appreciated,

Daniel.


You received this message because you are subscribed to the Google Groups “Bokeh Discussion - Public” group.

To unsubscribe from this group and stop receiving emails from it, send an email to [email protected].

To post to this group, send email to [email protected].

To view this discussion on the web visit https://groups.google.com/a/continuum.io/d/msgid/bokeh/356cb973-fab9-4143-bc12-e362f046fc3e%40continuum.io.

For more options, visit https://groups.google.com/a/continuum.io/d/optout.

<bokeh_plot (1).png>