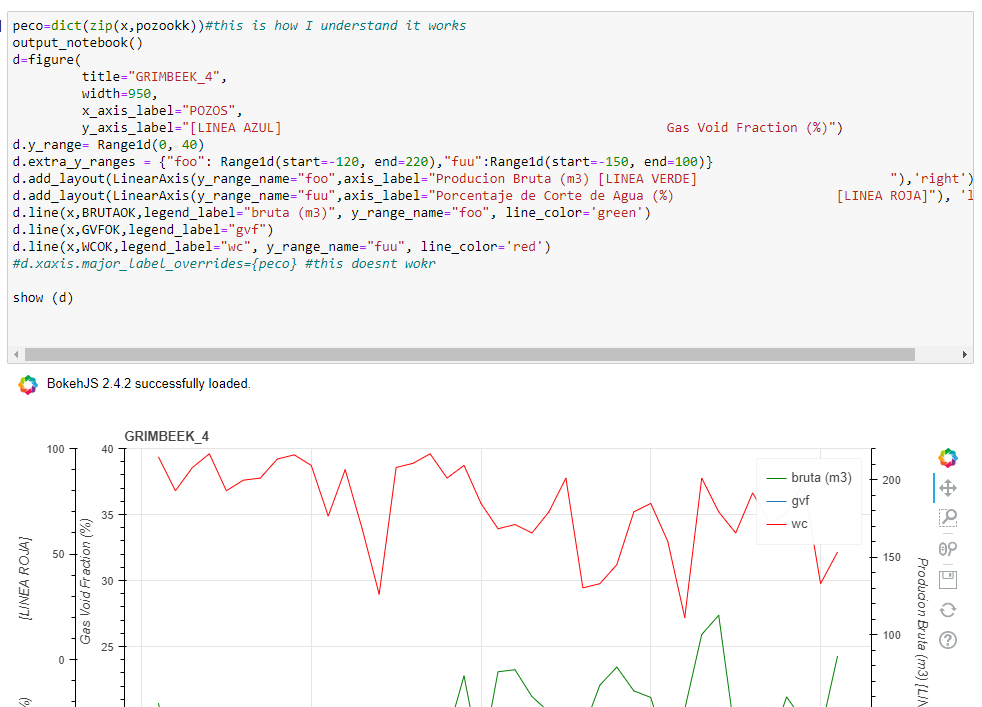
I need Help, Im working with a bokeh chart, and I need replace de x axis labels (other than numbers) and I cant find the way.
Atached the code
I need Help, Im working with a bokeh chart, and I need replace de x axis labels (other than numbers) and I cant find the way.
Atached the code
Hi @Gabriel_B I’m afraid it’s not clear what you are trying to accomplish. Please describe your intended goal in more detail.
@Bryan, sorry for that. I’m will try to explain with more detail.
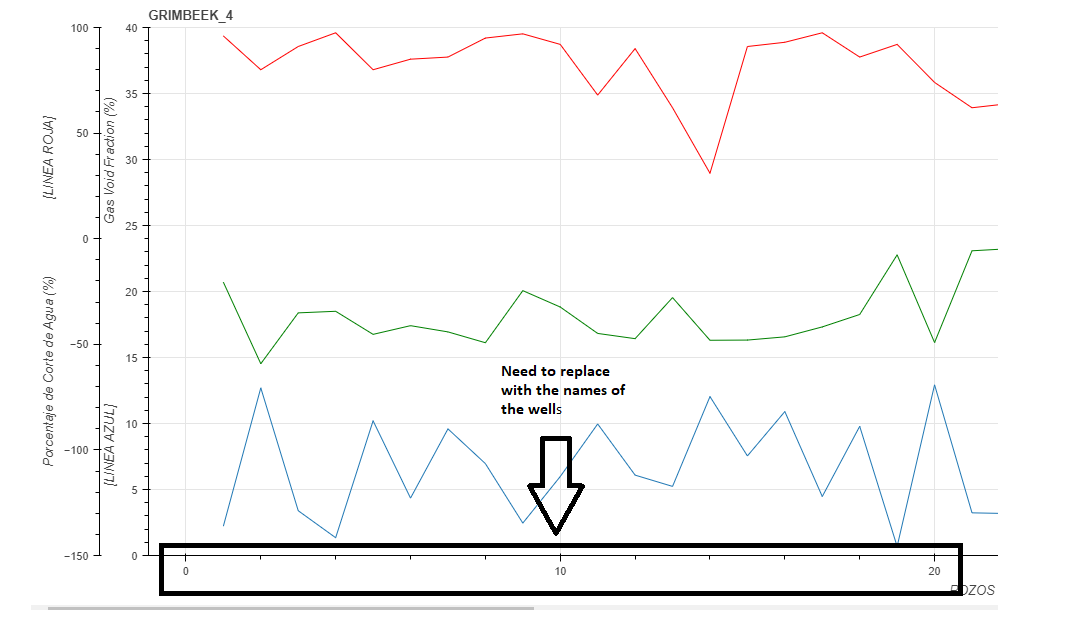
If you see the chart , the x axis is divided just in numbers (1,2,3,4 and so on…) but actually the three curves are values of water cut , production and Gas of different oil wells . So I have to replace the mumbers with the names of the wells.
So , in order to acomplish that, I generate a dict that you see in the script , so then apply that "major level overrides " but it doesn’t work .
Sorry for my English . It is not the best … I know
I agree with @gmerritt123 — if each x-coordinate represents a different well, then this is really categorical data, so categorical axis would be the most appropriate choice (and immediately solve your labeling need in the proper way). [1]
If you really want to use numeric coordinates, then I would need a complete Minimal Reproducible Example that I could actually run directly in order to investigate what the usage issue with the tick overrides is.
And as an aside: If this is categorical data, then drawing lines between the categories is also a dubious thing to do. The lines have no real meaning since a categorical space is not a metric space. It would be more sensible to draw markers at each point, or possibly vertical bars. ↩︎
that is correct. My fault
This topic was automatically closed 90 days after the last reply. New replies are no longer allowed.