I’m having the problem with the x-axis on my figure reversing. See attached code. To reproduce
- Pan until x=800 in fairly central
- Select Wheel Zoom.
- Zoom in really quickly.
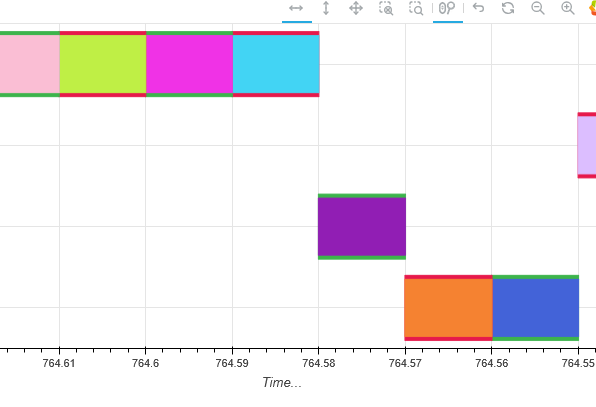
x-axis reverses to values are in decending order. Zoom out and they are still in decending order.
Doesn’t happen all the time, but probably 50% of the time for me.
What is wrong?
Picture
Code
from bokeh.core.properties import value
from bokeh.layouts import column
from bokeh.models import Legend, LegendItem
from bokeh.plotting import figure, curdoc
from bokeh.sampledata.autompg import autompg
from bokeh.transform import jitter

from bokeh.models import ColumnDataSource, FactorRange, Range1d, CustomJSFilter, GroupFilter, CDSView, LegendItem, \
    WheelZoomTool, BoxZoomTool, ZoomOutTool, ZoomInTool, PanTool, UndoTool, ResetTool, Legend
from bokeh.plotting import figure


def setup_figure():

    streams = ['Wi-Fi STA', 'Wi-Fi', 'Radio', 'Errors']
    event_types = ['Errors:Fault', 'Errors:Lost debug', 'Radio:Trim', 'Wi-Fi STA:Add vif', 'Wi-Fi STA:Del vif',
                   'Wi-Fi STA:Roam', 'Wi-Fi STA:STA Connect', 'Wi-Fi STA:STA Disconnect', 'Wi-Fi:Scan']

    status_colors = ['#e6194b', '#3cb44b']
    event_colors = ("#4363d8", "#f58231", "#911eb4", "#42d4f4", "#f032e6", "#bfef45", "#fabed4", "#469990", "#dcbeff")
    event_props = {'Duration': [], 'TimeStart': [], 'TimeEnd': [], 'TimeMid': [], 'SignalID': [], 'EventType': [],
                   'Details': [], 'VerboseDetails': [], 'EventGroup': [],
                   'EventColor': [], 'StatusColor': []}

    # Generate some data
    start_time = 0
    duration = 0.01
    for i in range(200000):
        event_props['SignalID'].append(i)
        event_props['Duration'].append(duration)
        event_props['TimeStart'].append(start_time)
        event_props['TimeEnd'].append(start_time + duration)
        event_props['TimeMid'].append(start_time + duration / 2)
        start_time += duration

        event_type = event_types[i % len(event_types)]
        stream, _, _ = event_type.partition(":")
        event_props['EventType'].append(event_type)
        event_props['Details'].append(event_type)
        event_props['VerboseDetails'].append(event_type)
        event_props['EventGroup'].append(stream)
        event_props['EventColor'].append(event_colors[i % len(event_colors)])
        event_props['StatusColor'].append(status_colors[i % len(status_colors)])

    end_time = start_time
    data_source = ColumnDataSource(data=event_props, name="timelineDataSource")

    y_range = FactorRange(factors=streams[::-1])
    x_range = Range1d(start=0, end=end_time / 4,
                      bounds=(-0.5, end_time + 0.5),
                      min_interval=0.0001,
                      max_interval=end_time / 2)

    fig = figure(width=615, height=400, sizing_mode='stretch_width',
                 y_range=y_range, x_range=x_range, name='timeline', lod_factor=10,
                 lod_threshold=1000, lod_timeout=100, output_backend='webgl'
                 )

    x_axis = fig.xaxis[0]
    x_axis.formatter.power_limit_high = 7
    x_axis.formatter.power_limit_low = -7
    x_axis.axis_label = "Time..."

    inline_js = """
        const N = source.get_length()
        const indices = new Array(N);
        const colors = source.data['StatusColor']
        for (let i = 0; i < N; i++) {
            indices[i] = (colors[i] !== '#ffffff')
        }
    """

    status_filter = CustomJSFilter(code=inline_js)

    status_renderers = []
    event_renderers = []
    legend_items = []

    for event_type in event_types:
        # create filtered views to select events of just this type from the column data source
        # (filters are computed in the browser by Bokeh)
        event_filter = GroupFilter(column_name='EventType', group=event_type)

        # plot taller boxes in status colour underneath boxes in event colour
        # this creates a top-bottom border for events with the status colour when rendered

        # get events of just this type which have a known status
        event_status_view = CDSView()
        event_status_view.filter &= status_filter
        event_status_view.filter &= event_filter
        r_status = fig.rect(x='TimeMid', y='EventGroup', width='Duration',
                            height=0.8,
                            line_color='StatusColor', fill_color='StatusColor', alpha=1,
                            source=data_source, view=event_status_view, dilate=True)

        event_view = CDSView(filter=event_filter)
        r_event = fig.rect(x='TimeMid', y='EventGroup', width='Duration', height=0.7,
                           line_color='EventColor', fill_color='EventColor', alpha=1,
                           source=data_source, view=event_view, dilate=True)

        legend_items.append(LegendItem(label=event_type, renderers=[r_status, r_event]))
        status_renderers.append(r_status)
        event_renderers.append(r_event)

    legend = Legend(items=legend_items, click_policy="hide", title='Click to hide/show events',
                    name=f'{fig.name}Legend0', visible=True)

    fig.add_layout(legend, 'right')

    zoom_tools = [WheelZoomTool(dimensions="width"),
                  BoxZoomTool(dimensions="width"), BoxZoomTool(),
                  ZoomOutTool(dimensions="width"), ZoomInTool(dimensions="width")]
    pan_tools = [PanTool(dimensions="width"), PanTool(dimensions="height"), PanTool()]
    tools = [UndoTool(), ResetTool(), *pan_tools, *zoom_tools]

    fig.tools = tools
    fig.toolbar_location = "above"
    fig.toolbar.active_drag = pan_tools[0]

    return fig

p1 = setup_figure()

# add column - need to run this with bokeh --serve
curdoc().add_root(column(p1, sizing_mode='stretch_width'))