I need to display longer x-axis labels, But the text got truncated from right side, Is there any way to avoid that? Can we add padding?
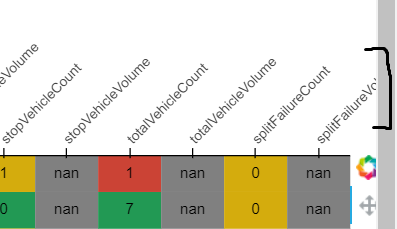
The name of Metric is SplitFailureVolumne but we can only see half of it. Any workaround?
I need to display longer x-axis labels, But the text got truncated from right side, Is there any way to avoid that? Can we add padding?
The name of Metric is SplitFailureVolumne but we can only see half of it. Any workaround?
How to pad plot borders is described in the documentation:
I’m not able to fix this using padding. I want to move the plot to left or tools to the right so that I can see the full text in the top right corner of the plot.
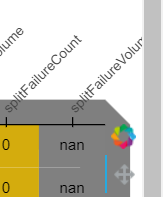
I’m not able to see the full text, SplitFailureVolumne
Please provide a runnable minimum example of what you attempted to help contributors make concrete recommendations on what to change.
The plot in the latest post looks like the changes you made had some effect on the rendering of the plot and the label, i.e. it differs from the original image and shows more of the label, even if the whole rightmost label is not visible.
@zia_kayani to ampify @_jm’s comment, without code I have no idea what “not able to fix this with padding” means since it is 100% the case that you can add as much padding as you need:
from bokeh.plotting import figure, show

cats = ["a", "bc", "d ef"*30]

p = figure(x_range=cats, y_range=(0,10), x_axis_location="above")
p.xaxis.major_label_orientation = 0.5

#p.min_border_right = 200

show(p)
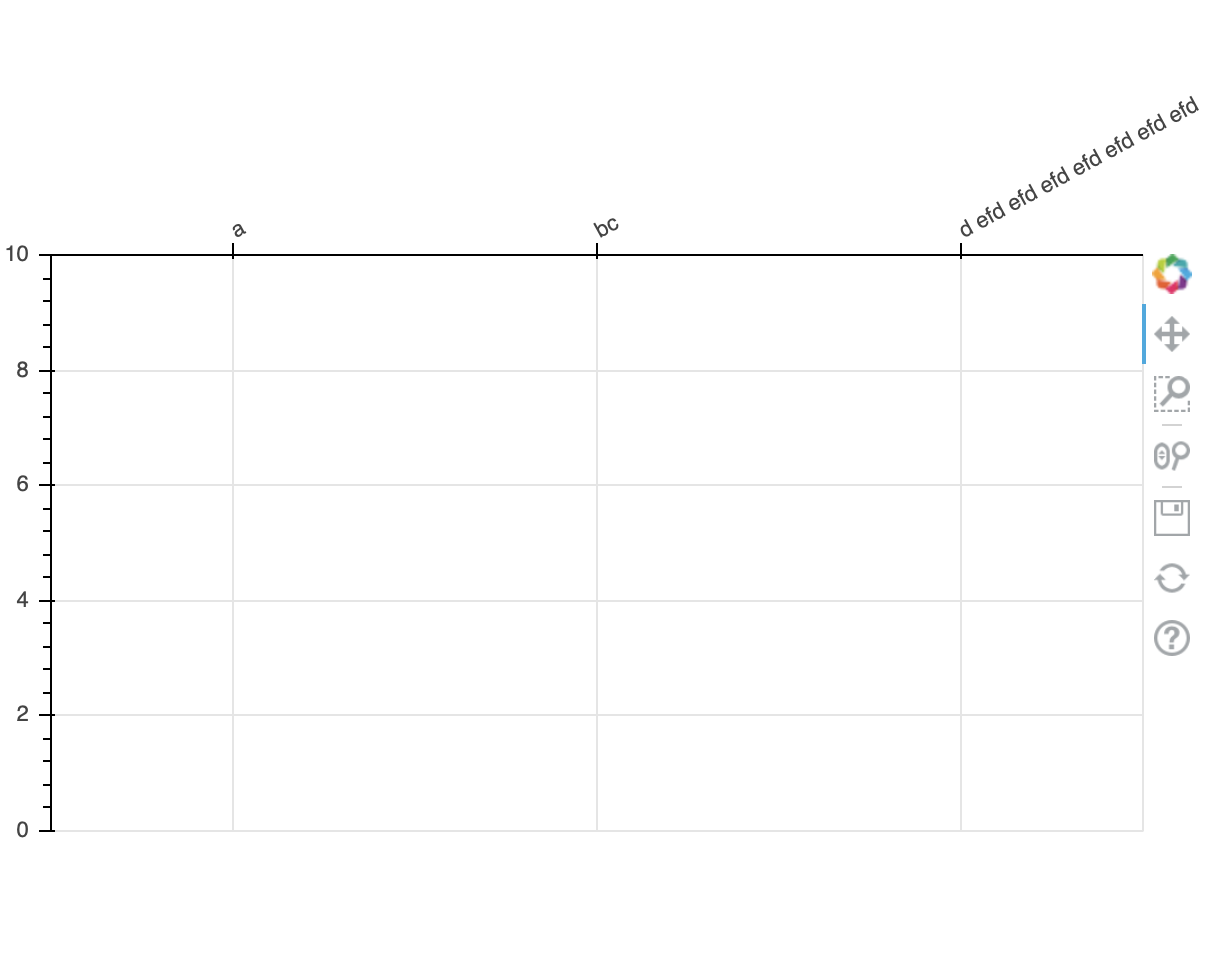
Without padding (truncated)
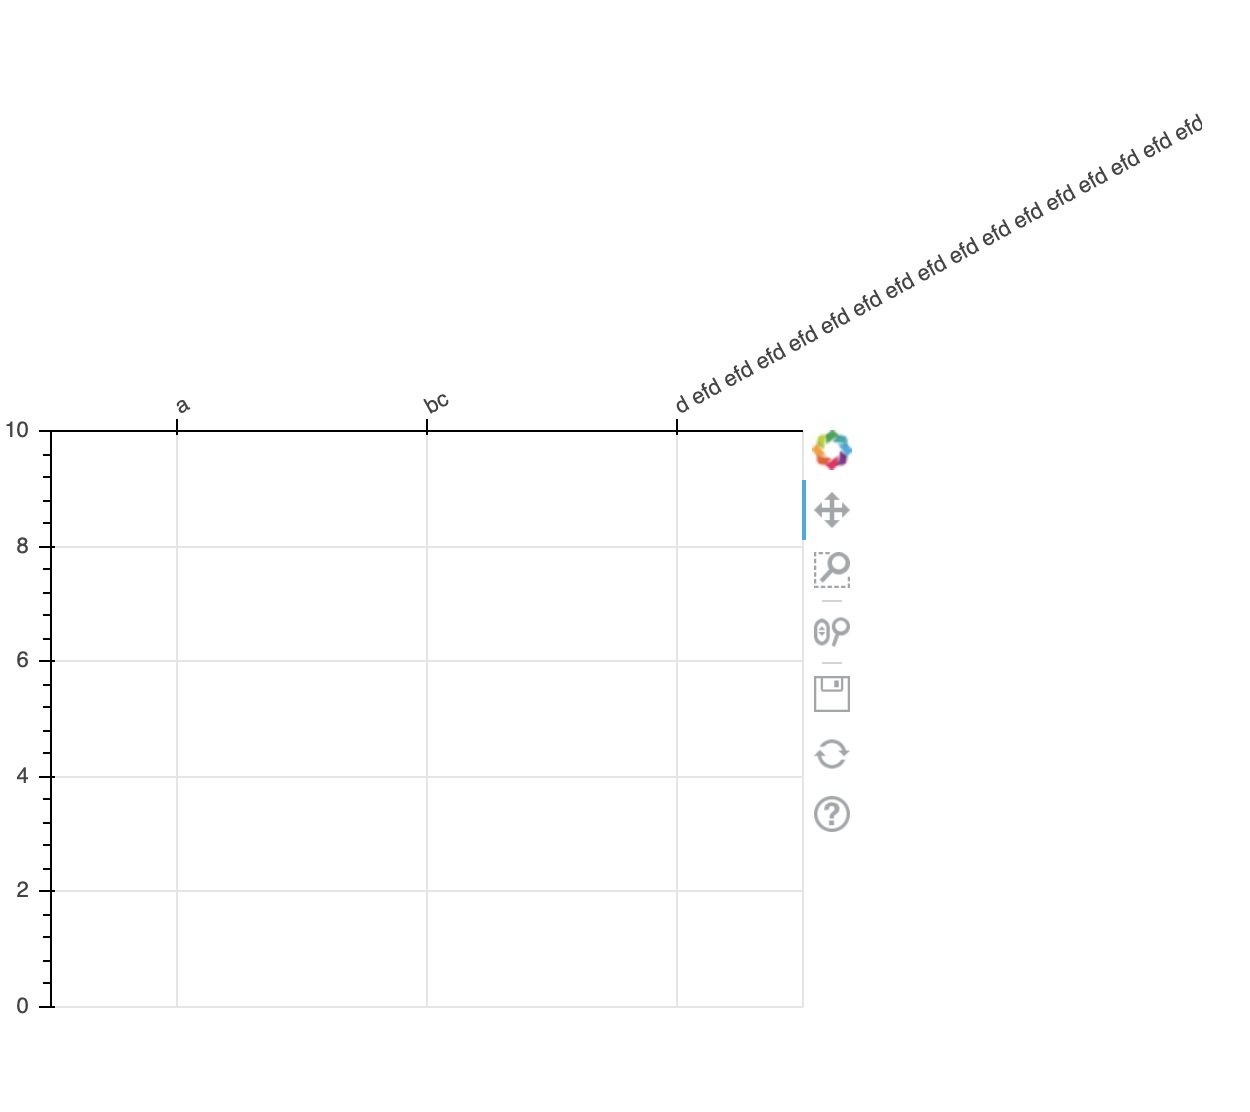
With padding (NOT truncated)