Hello - I’m trying to figure out why a plot I’m passing to the components() method is failing to return the key:value pairs { “modelid” : something } and { “elementid” : something } within the <script> variable “render_items”.
Right now, “render items” looks like this in the <script> printout:
var render_items = [{"docid":"73c7618a-ac07-4c1b-8c7d-6fd7c45e09c3","root_ids":["1004"],"roots":{"1004":"6d7217d4-2782-45c9-aed2-add321249b95"}}];
For some context, I want to embed a series of Bokeh figures into a Flask-powered html, and I’ve separated bulk of the Bokeh graph building logic from the routes.py script used to render the html template. I’ve done this to keep the routes.py script tidy, since it has a lot of other stuff going on. Right now, I’m in the early stage of development and just want to get a plot to render to the html page.
This is what the user defined class (which is named BokehObject) method being called in routes.py looks like:
def dotplot_skeleton(self):
    source = ColumnDataSource()
    source.data =  dict(
        x = self.report_df["NAME"].to_list(),
        y = self.report_df["READ_COUNT"].to_list() )
    dotplot = figure(plot_height=600, plot_width=720)
    dotplot.circle(x="x", y="y", source=source, size=5, line_color=None)
    dotplot.xaxis.axis_label = "NAME"
    dotplot.yaxis.axis_label = "READ_COUNT"
    return dotplot
For reference, report.df is a dataframe populated by a different class method. It is working correctly.
Then, in routes.py, I retrieve the plot defined by the class, and pass it to the components() method:
bo = BokehObject(Results.query.get(results_id))
    dotplot = bo.dotplot
    script, div = components(dotplot)
    return render_template('items/vis.html',
                            plot_script=script, plot_div=div,
                            js_resources=INLINE.render_js(),
                           css_resources=INLINE.render_css())
Finally, my .html document ‘vis.html’, which lives in a templates folder called ‘items’, looks like so:
<!DOCTYPE html>
<html lang="en">
<head>
    <meta charset="UTF-8">
    <meta name="viewport" content="width=device-width, initial-scale=1.0">
    <title>Flask + Bokeh</title>
    {{ js_resources|indent(4)|safe }}
    {{ css_resources|indent(4)|safe }}
    {{ plot_script|indent(4)|safe }}
</head>
<body>
    <h1 style="text-align: center; margin-bottom: 40px;">Flask + Bokeh</h1>
    <div style="display: flex; justify-content: center;">
    {{ plot_div|indent(4)|safe }}
    </div>
</body>
</html>
Earlier, as the Bokeh Doc for bokeh.embed suggests, the html document also contained the lines:
<script src="https://cdn.bokeh.org/bokeh/release/bokeh-2.3.1.min.js"></script>
<script src="https://cdn.bokeh.org/bokeh/release/bokeh-widgets-2.3.1.min.js"></script>
<script src="https://cdn.bokeh.org/bokeh/release/bokeh-tables-2.3.1.min.js"></script>
But these did not seem to have an effect on the outcome.
I’ve been attempting to follow an example of this implementation I found here:
Interactive Realtime Visualiation with Bokeh+Flask
The main difference between how the example does it and I’m trying to do it is how the source.data attribute is being populated. In their case, they pull in a CSV from a website called “easybase.io”. I can’t do that due to the sensitivity of my data, so instead I’m just flattening the returned dataframe report_df with a .to_list() call.
This blog describes js_resources() and css_resources() as “general Bokeh-required JavaScript” and “General Bokeh-required CSS”, respectively; but it did a poor job explaining how the INLINE call to these methods works. I suspect that this is the root cause of my problem, given that all my variables seem to be populating correctly.
I’ve checked and double checked my dependancies. I don’t think those are causing the issue. I’ve been referencing documentation for v.2.3.1 and have that version installed.
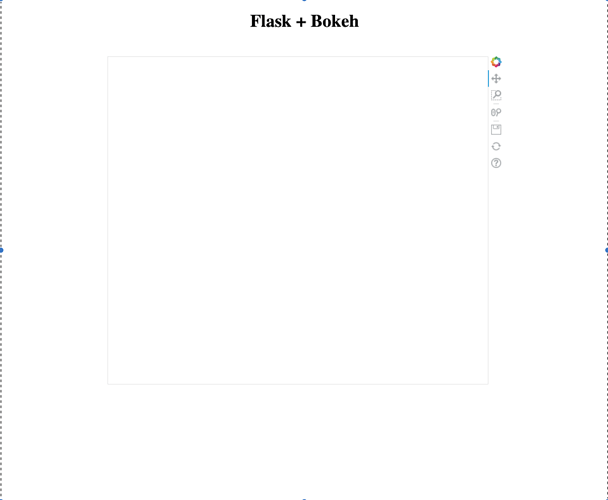
I’ve done pretty extensive testing to ensure that the dataframe being passed to source (which you see when I’m constructing the plot in my BokehObject) is filling out properly. I’ve also found that within the source attribute source.data, the “x” and “y” I define there seem to be correct. When I run my flask application, I get the following:
So, the plot appears to be constructing, but the data is not being passed, or isn’t plotting, or something.
Why do I not see modelid or elementid in the <script> dict? I’m guessing they are crucial to getting the data to plot.
If you want to try and reproduce my error, you will need two files at minimum; an html that retrieves stuff from the render_template() method in the routes file, and of course that routes.py file that defines the plot and generates a <script> and <div>.
