I’ve got a rather complex Flask + Bokeh project that retrieves a .tsv, visualizes it, and lets the user mess with the visualization.
Because of the complexity of the project, the script defining the ‘route’ to the server, the script defining the bokeh logic, and the .html script are in three different files. I implemented all the bokeh stuff (including figure construction, population of the source variable, and CustomJS logic) as methods/instance variables of a user-defined class called BokehObject, to pay the ‘technical burden’ up front and make the ‘routes’ script as neat as possible. I’ve attempted to replicate that in my minimum reproducible example shown below. The only difference is that the ‘routes’ file and the BokehObject class implementation are in the same script.
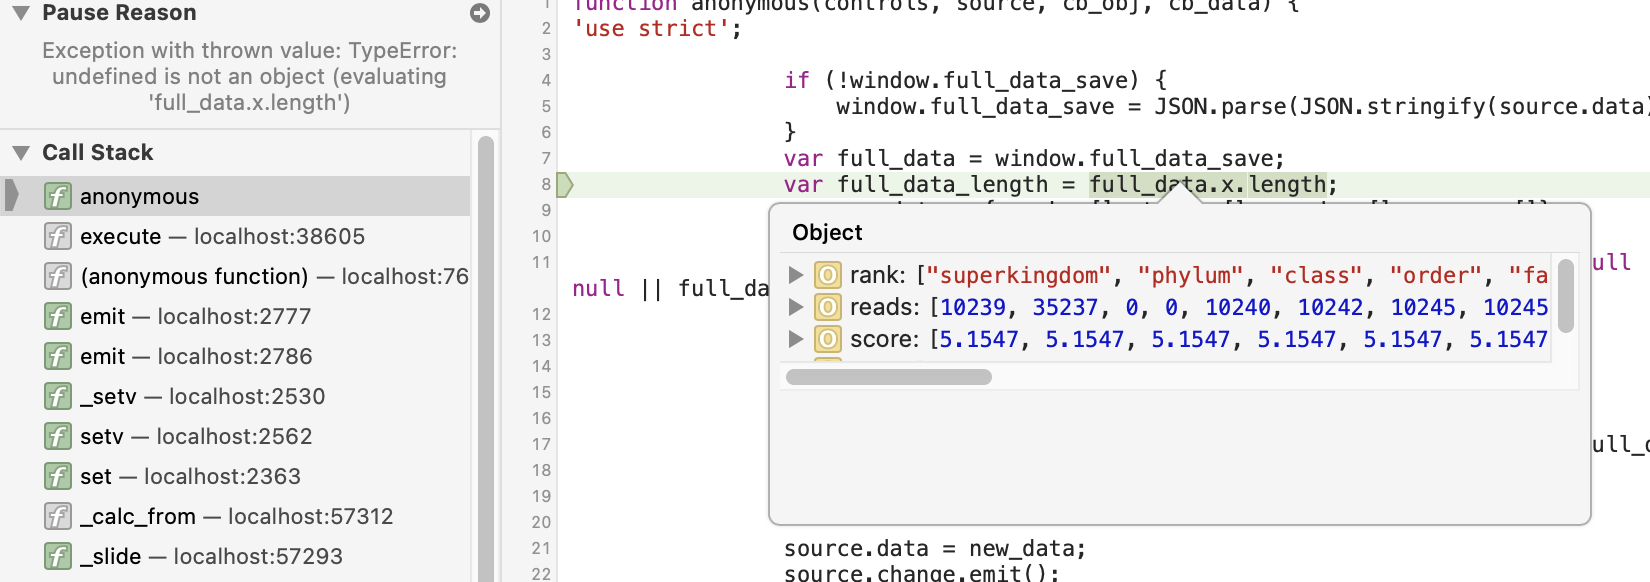
I’ve already confirmed the method returning the list containing the CustomJS object is correctly returning that CustomJS object and the widgets/controls - but the JS code itself doesn’t appear to be functioning properly. The widgets appear in the application, but the sliders do not appear to be functional. They don’t filter the data or update the number right above the widget.
I have no idea how to debug/step-through Javascript code that is embedded in a Python script, but executed by the server! As far as I can tell, the JavaScript syntax is right. But I must be missing something somewhere, either in the control_list logic or the actual callback code. If I had to guess though, I think the issue may be the widget logic in control_array, so a few pointers would be much appreciated.
I’ve attached the two scripts needed for a minimum reproducible example. The first one defines the BokehObject class I made and a basic ‘route’ to localhost:5000. To reproduce the problem, this file should be named app.py.
Preface: I apologize for many of the unneeded extra steps included in this example implementation of my BokehObject class. It will seem totally unneeded here. I made some lazy adjustments from the more complicated project, such that the class implementation would be involved for the example. Additionally, I included a lot unneeded imports and whitespace. I’ve included them just in case some weird masking issue I am unaware of is going on, and in the real project the weird whitespace is helping keep my script organized. Here is app.py:
from flask import Flask, render_template
import pandas as pd
import numpy as np
import sys
import os
import json
from math import pi
from operator import itemgetter
import re
import hashlib
from os.path import dirname, join, isfile
from bokeh.io import curdoc
from bokeh.plotting import figure, output_file, show
from bokeh.layouts import row, layout, widgetbox, column
from bokeh.models import ColumnDataSource, HoverTool, Div, FactorRange, Range1d, TapTool, CustomJS, ColorBar, CDSView, GroupFilter, MultiSelect, MultiChoice
from bokeh.models.widgets import Button, Slider, Select, TextInput, RadioButtonGroup, DataTable, TableColumn, NumberFormatter, Panel, Tabs, HTMLTemplateFormatter
from bokeh.models.callbacks import CustomJS
from bokeh.palettes import RdYlBu11, Spectral4, Spectral11, Set1, Viridis256
from bokeh.util import logconfig
from bokeh.resources import INLINE
from bokeh.embed import components, autoload_static
from bokeh.transform import factor_cmap, linear_cmap
from pathlib import Path
import math

app = Flask(__name__)

@app.route('/')
def index():

    class BokehObject:

        def __init__(self):
            self.source = self.source_make()
            self.df = self.just_df()
            self.dotplot = self.make_figures()
            self.controls_and_logic = self.control_jslogic()

        def just_df(self):

            d = {'LEVEL': ['superkingdom', 'phylum', 'class', 'order', 'family', 'genus', 'species', 'strain'],
                'NAME': ['Viruses', 'dsDNA viruses, no RNA stage', 'Poxviridae - no_o_rank - no_c_rank', 'Poxviridae - no_o_rank', 'Poxviridae', 'Orthopoxvirus', 'Vaccinia virus', 'Vaccinia virus strain WR (Western Reserve'],
                'READ_COUNT' : [10239.0, 35237.0, 0.0, 0.0, 10240.0, 10242.0, 10245.0, 10245.1], 'LINEAR_COV' : [6723.01, 6723.01, 6723.01, 6723.01, 6723.01, 2008.6, 2008.6, 2008.6],
                'SCORE' : [5.1547, 5.1547, 5.1547, 5.1547, 5.1547, 5.1547, 1.5651, 1.5651]}

            d = pd.DataFrame(data=d)

            return d

        def source_make(self):

            d = {'LEVEL': ['superkingdom', 'phylum', 'class', 'order', 'family', 'genus', 'species', 'strain'],
                'NAME': ['Viruses', 'dsDNA viruses, no RNA stage', 'Poxviridae - no_o_rank - no_c_rank', 'Poxviridae - no_o_rank', 'Poxviridae', 'Orthopoxvirus', 'Vaccinia virus', 'Vaccinia virus strain WR (Western Reserve'],
                'READ_COUNT' : [10239.0, 35237.0, 0.0, 0.0, 10240.0, 10242.0, 10245.0, 10245.1], 'LINEAR_COV' : [6723.01, 6723.01, 6723.01, 6723.01, 6723.01, 2008.6, 2008.6, 2008.6],
                'SCORE' : [5.1547, 5.1547, 5.1547, 5.1547, 5.1547, 5.1547, 1.5651, 1.5651]}

            df = pd.DataFrame(data=d)

            source = ColumnDataSource()
            source.data = dict(
                    rank = df['LEVEL'].tolist(),
                    taxa = df['NAME'].tolist(),
                    reads = df['READ_COUNT'].tolist(),
                    score = df['SCORE'].tolist())

            return source

        def control_jslogic(self):

            control_list = []

            controls = {
            "reads" : Slider(             title = "Minimum Raw Read Count",   value = 0,   start = 0,   end = 500000,   step = 1000),
            "score" : Slider(             title = "Minimum Score",            value = 0.5, start = 0.5, end = 10,     step = 0.1)
                        }

            controls_array = controls.values()

            callback = CustomJS(args=dict(source=self.source, controls=controls), code="""
                if (!window.full_data_save) {
                    window.full_data_save = JSON.parse(JSON.stringify(source.data));
                }
                var full_data = window.full_data_save;
                var full_data_length = full_data.x.length;
                var new_data = { rank: [], taxa: [], reads: [], score: []}
                for (var i = 0; i < full_data_length; i++) {
                    if (full_data.rank[i] === null || full_data.taxa[i] === null || full_data.reads[i] === null || full_data.score === null)
                        continue;
                    if (
                    full_data.reads[i] > controls.reads.value &&
                    full_data.score[i] > controls.score.value
                    )   {
                    Object.keys(new_data).forEach(key => new_data[key].push(full_data[key][i]));
                    }
                }

                source.data = new_data;
                source.change.emit();
            """)

            control_list = [controls_array, callback]
            return control_list

        def make_figures(self):

            fig = figure(plot_height=600, plot_width=720, x_range = FactorRange(*self.df["NAME"].unique()))
            fig.circle(x="taxa", y="reads", source=self.source, size=5)
            fig.xaxis.axis_label              = "Score"
            fig.yaxis.axis_label              = "Number of Reads"
            fig.xaxis.major_label_orientation = 3.1415926/4
            fig.yaxis.axis_label              = "Read Count"

            return fig

    bo = BokehObject()

    fig = bo.dotplot

    control_list = bo.controls_and_logic
    control_array = control_list[0]
    callback = control_list[1]

    for single_control in control_array:
        single_control.js_on_change('value', callback)

    inputs_column = column(*control_array, width=320, height=1000)
    layout_row = row([inputs_column, fig])

    script, div = components(layout_row)
    return render_template(
        'index.html',
        plot_script=script,
        plot_div=div,
        js_resources=INLINE.render_js(),
        css_resources=INLINE.render_css(),
    )

if __name__ == "__main__":
    app.run(debug=True)
This next one is the html template (named index.html):
<!DOCTYPE html>
<html lang="en">
<head>
<meta charset="UTF-8">
<meta name="viewport" content="width=device-width, initial-scale=1.0">
<title>Document</title>
{{ js_resources|indent(4)|safe }}
{{ css_resources|indent(4)|safe }}
{{ plot_script|indent(4)|safe }}
</head>
<body>
<h1 style="text-align: center; margin-bottom: 40px;">Flask + Bokeh</h1>
<div style="display: flex; justify-content: center;">
    {{ plot_div|indent(4)|safe }}
</div>
</body>
</html>
To run this example, you’d need to create a new python project, and arrange the files like so:
Project Name:
→ app.py
→ templates
-------> index.html
I’ve abstracted away a lot of the detail from the real project that might come into play here; I honestly don’t know. These are the main potential factors I can think of:
-
The file
index.htmlhas a different name and more complicated route (it is a page that is part of a larger GUI), whose path is defined by inserting an ‘ID’ number related to the .tsv file the dataframe is constructed from. As far as I can tell though, the dataframe and the source variable is populating correctly, and is being passed to theCustomJSwidget controls properly. In this example I created a mini dataframe that looks sort of like the real data instead. -
There are a lot more columns in the
sourcevariable and a lot more widgets in the visualizer. I’m not sure if they are interacting in some strange way. -
I made a separate forum post related to this same project, which you can find here: Issue with components() return value
In that post, I mention an example I followed to get thescriptanddivvariables thatcomponents()requires to pass to the.htmland construct the webpage. That example can be found here:
While comparing my script with the example, you’ll notice that I follow the syntax for theCustomJS()part very closely, and that the widgets on the subsequent webpage appear to be functional. Maybe there is a problem with the call tocomponents()after all?