Box Plot with responsive Labels using CustomJS

Hello. How are you?
With the same motivation as the one expressed on [Colorbar Span / Custom tick],(Colorbar Span / Custom tick) I want to map my heatmap colorbar into a more broad scale. Instead of adding custom ticks (which doesn’t seem viable right now), I opted to try to create a kind of box plot (world score on the image below).


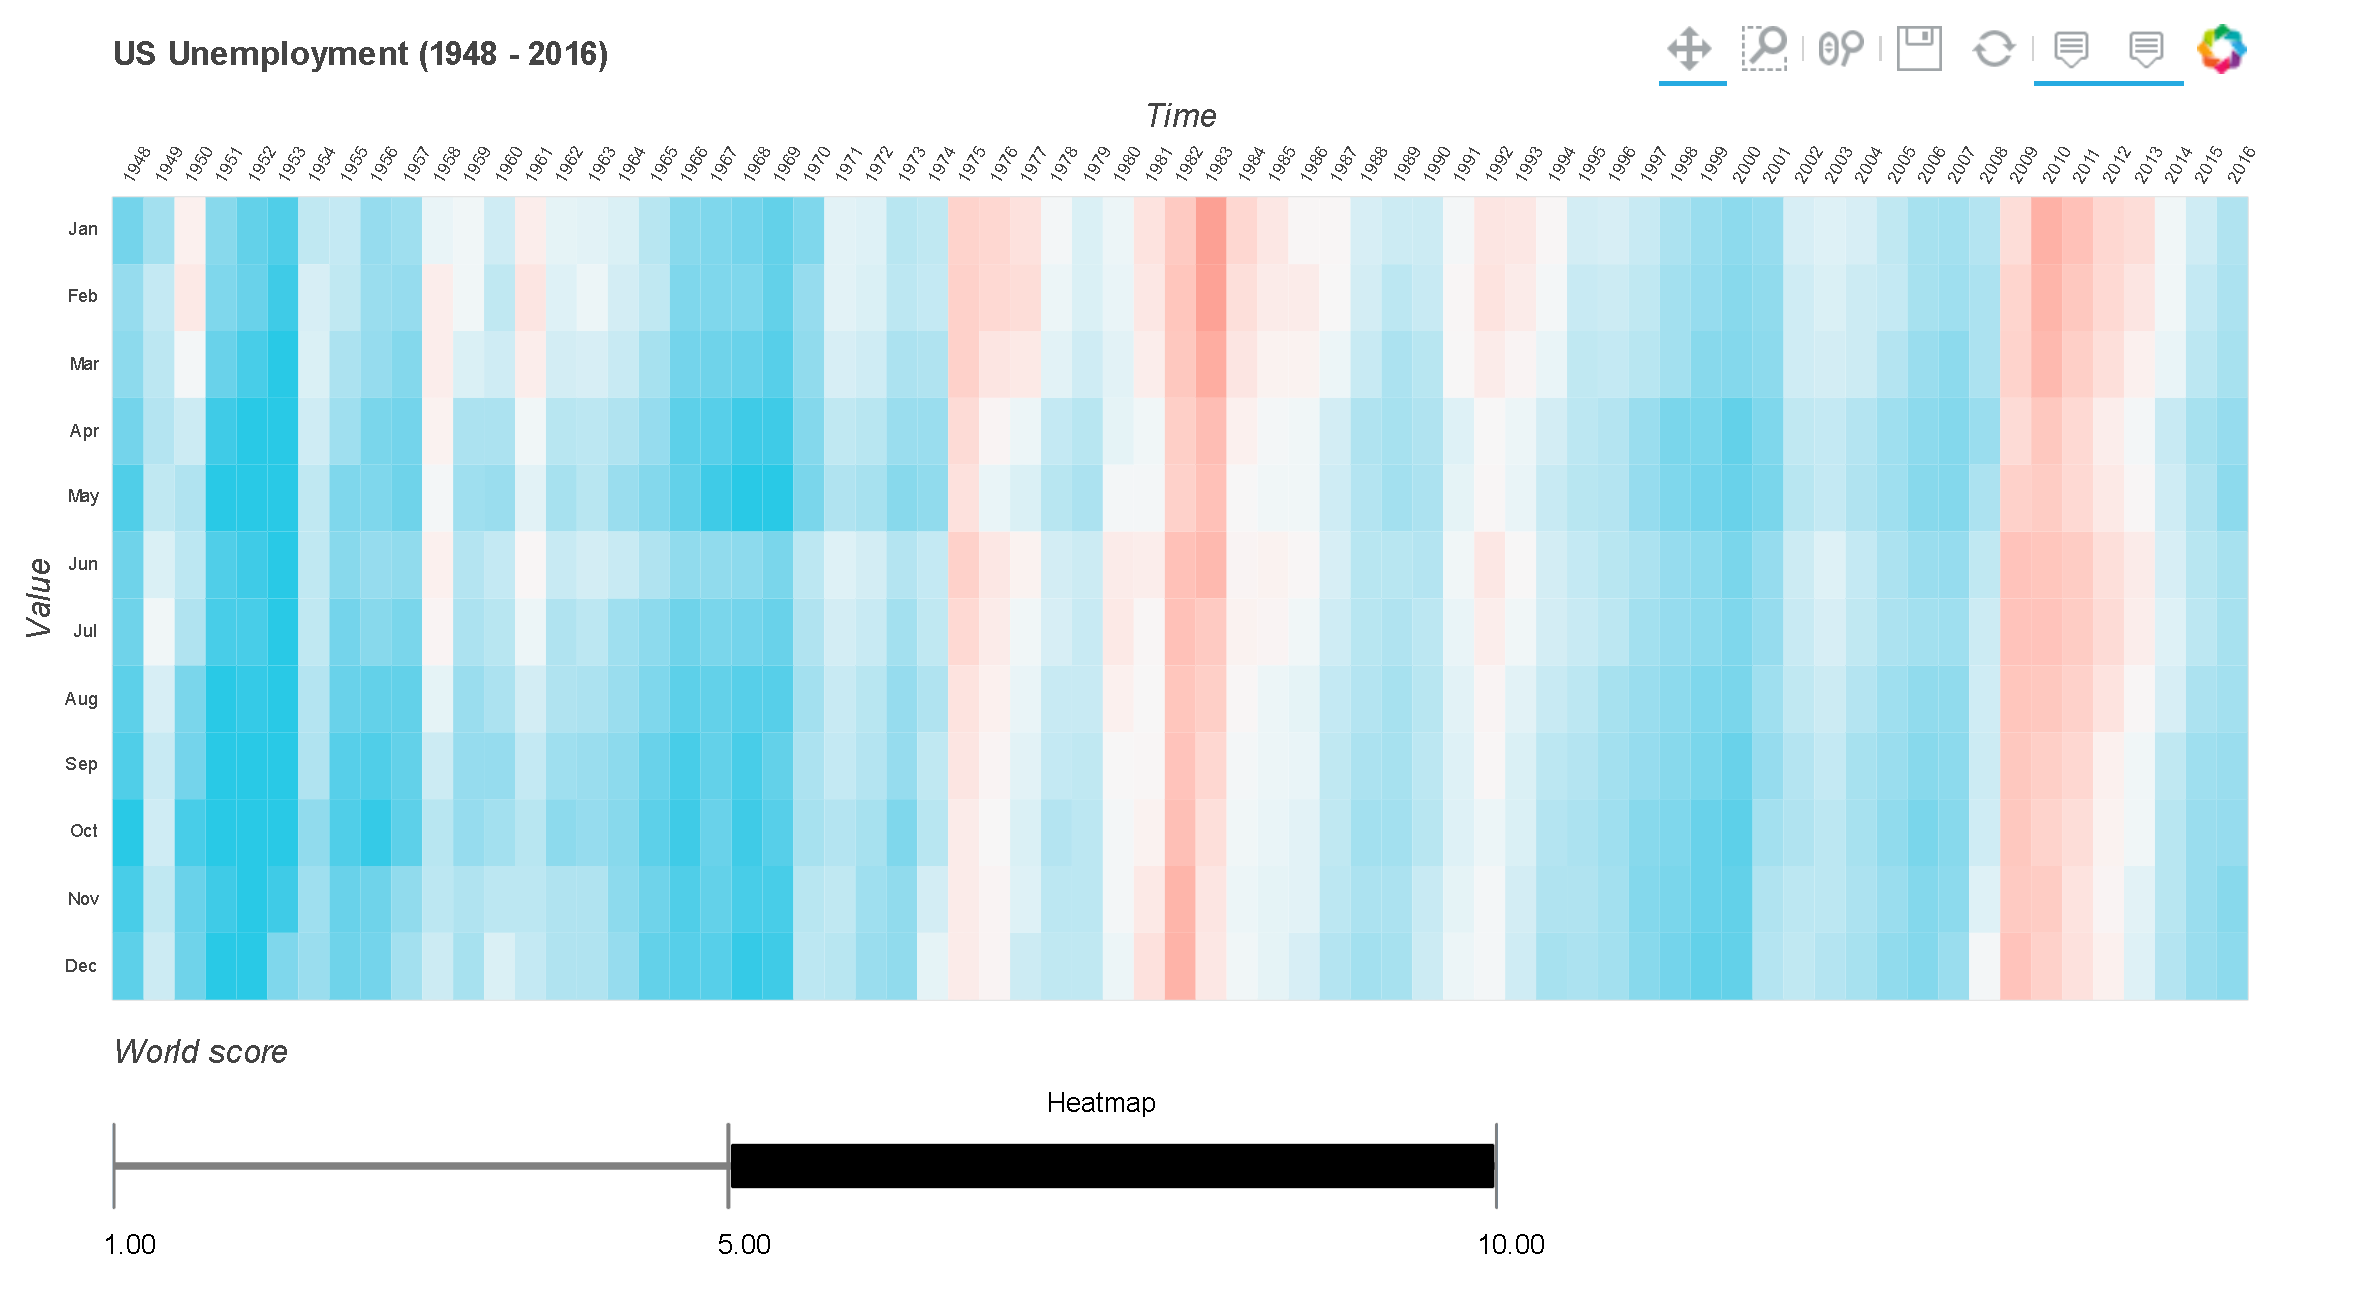
The plot shown was done with the code present here.

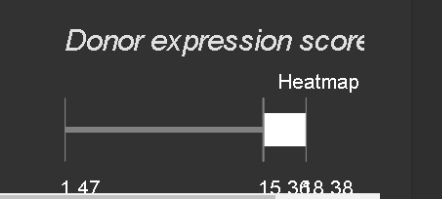
My problem is that when I change the size of the container where the plot is displayed the labels do not resize correctly:

image

I think I potentially can fix the issue by using a CustomJS callback, triggered when the plot width changes but I couldn’t find a way to trigger the callback at that instant. Is there any way to do that and if so could you point me to the correct way to do it?
I’m also open to any other strategy to generate the type of plot presented.
Thanks.

Not exactly the answer to my question but a valid solution is to abandon the idea of dealing with the responsiveness by myself (using a callback) and instead use the property text_align='center/right/left' in the label.

I’m still interested to know if it’s possible to trigger a callback when the size of the plot changes?

More or less. You can add callbacks for the read-only properties plot.inner_width and plot.inner_height. These is not the dimensions of the actual DOM canvas element, but the dimensions of the central plot area between the axes.

1 Like

That’s exactly what I wanted. Thank you

    from bokeh.models.callbacks import CustomJS

    callback = CustomJS(args=dict(xr=b), code="""

    // JavaScript code goes here

    console.log(cb_obj)
    console.log(xr)

    """)
    b.js_on_change('inner_width', callback)
1 Like