I am trying to use the selection tools to highlight (actually fade out everything non-selected) parts of an image and work with the selected part.
Out of the box this does not work. I suppose because the glyphs of an image are not supported by the selection tools?
The pixels of an image are not visibly selected, neither does the
I only found examples for the scatter-plot.
Am I trying to use the image-plot in a way it was not designed for? Should I use something else instead? Is there a workaround? What’s the appropriate way to tackle my problem?
Edit2: I found “image_indices” mentioned in Bokeh release notes(0.12.15) and as a property in the console (if I console.log the data_source obj). However I do not find any documentation for it. Was that feature forgotten or am looking at something completely wrong?
Edit + Edit(3):
Here’s the source code:
from bokeh.io import curdoc
from bokeh.layouts import row
from bokeh.palettes import grey
from bokeh.plotting import figure
import numpy as np

frame_zero = np.random.rand(40, 60)
len_x = 60
len_y = 40


def create_figure():
    tools = ["lasso_select,box_select"]
    plot = figure(title="image_1", tools=tools, plot_width=len_x*10, plot_height=len_y*10)

    plot.x_range.range_padding = plot.y_range.range_padding = 0
    img = plot.image(image=[frame_zero], x=0, y=0, dw=len_x, dh=len_y, palette=grey(50))

    img.data_source.selected.on_change('indices', selector_callback) # <------------- Clearly not the way to do it/doesnt work
    return plot


def selector_callback(attr, old, new):  # <--------------- Not being fired
    print(attr, old, new)


layout = row(create_figure())
curdoc().add_root(layout)
all the image glyphs currently only support “point” hit testing, and AFAIK even this is only usable by the hover tool.
No one has ever really asked about this before, and I can’t find a relevant issue, so certainly feel free to submit a GitHub Issue about adding selection support to images.
Edit:
However I do not find any documentation for it. Was that feature forgotten or am looking at something completely wrong?
So far it was only partially implemented, just enough to support using a hover tool on images. It is currently an internal, JS-only property, and hence intentionally undocumented. More work would be needed to make it usable for selections by users. One main obstacle is simply that expressing selections on images, which in general can be arbitrarily disjoint unions of points, rows, columns, or regions, is just very tediously complicated. The internal property type is
And that’s already simpler that it would really need to be, due to having some assumptions baked in. I am just not comfortable exposing that mess directly to users. OTOH I am also not sure how it might be improved for public consumption.
As a concrete example of the difficulties: lasso selections on images are especially problematic. Suppose you have a 2000x2000 pixel image. That is 4 million individual indices. How do you compactly represent a lasso selection on an image? In general, a lasso selection region can have a completely arbitrary (and even disjoint) shape, so I am not sure you can do anything other than enumerate all the individual indices inside. But with images that could very easily grow to lists of hundreds of thousand or millions (or more) and that would have extremely bad performance implications.
As an alternative, you can get the raw selection geometry events and do whatever you need to do based on those. Ultimately that may be the best/only bet, certainly at least for now. But especially if you require lasso selections. I think we could potentially support point and rect and line selections on images, but I am skeptical about lasso support ever being feasible.
Thanks for the detailed response, I appreciate it.
Yeah, I can see the problems arising from the computation of some-million indices. For me it would only be in the (tens of) thousands, as my resolutions are rarely ever above 300x300 and the selections are even smaller.
I think I will use the selection geometry events then. Their advantage is that I can draw a selection square and keep selecting everything in the square (even as image frames change), which I would use for live-computation (calculating mean, std, etc…) to display in a seperate figure.
That should work, right? I just hope that I don’t get locked out of possibilities at some point.
Seems reasonable to me, at least based on my limited knowledge of the problem to solve.
I just hope that I don’t get locked out of possibilities at some point.
I’m not sure I know the concern is here. I would not expect SelectionGeometry to go away or even change in any appreciable way, if that is the question.
Hi again,
thanks for helping me clean up the mess I had in my head.
I mimicked the selection by using the EditBoxTool.
The Alpha-change was mimicked by putting an overlay over my entire main image except the part where the rect was created.
I’ll attach a short clip, as I actually encountered, not only expected, but also weird problems. Demo
Problem 1 is expected, 2&3 feel just unintended/weird:
EDIT: I managed to fix this problem using your answer @ SO, thanks! HoverTool shows data for every Glyph that it’s hovering over, after I created the rect it shows the data of the image (which I want) but also the data of the rect and of the overlay (val: ???). Is there a way to specify the Glyphs that are relevant for the HoverTool?
The WheelZoomTool works as expected if I scroll with my cursor ON the image. If I move the cursor onto the ColorBar on the right and scroll my image zooms only along the Y-Axis? That is obviously not what I want.
For some reason bokeh.plotting.Figure.image flips the image along the x-axis before rendering it?
This behaviour was also already mentioned in 2015: Discourse Thread
This is extra irritating as I use the rect that I created with the EditBoxTool as a ROI.
I then use the bounds of that ROI to select the corresponding data from my image.data_source.
The 2d-array retrieved has the correct data but it is not flipped (unlike the rendered image).
So the image.data_src.data is not flipped but in the rendering process the image somehow gets displayed flipped?
I would expect bokeh to behave like matplotlib here (just like mentioned in the discourse).
There’s not enough information here to speculate. Do you mean “outside the central plot area”? If so that is intended behavior. scrolling on an “axis area” outside the main plot viewport is an intentional mechanism to selectively scroll a single axis. You can turn that off, but only in the sense that scrolling outside the plot area will have no effect whatsoever.
For some reason bokeh.plotting.Figure.image flips the image along the x-axis before rendering it?
Definitely would need an MRE to investigate and actually observe what is happening.
Definitely would need an MRE to investigate and actually observe what is happening.
I addressed this in this Issue. So it’s intended and I’ll just np.flipud the image before feeding it into the image.data_source.
There’s not enough information here to speculate. Do you mean “outside the central plot area”? If so that is intended behavior. scrolling on an “axis area” outside the main plot viewport is an intentional mechanism to selectively scroll a single axis. You can turn that off, but only in the sense that scrolling outside the plot area will have no effect whatsoever.
The main idea is that I want to keep the ratio of width:height 1:1 to maintain a pixel-ish look for my image. This works fine for the main image but if you zoom with the cursor on the color it will only zoom in the Y-Axis.
You mentioned a way to disable the zoom on the ColorBar? If not; is the only solution to move the ColorBar to its own figure/add it separately?
You mentioned a way to disable the zoom on the ColorBar?
Not the colorbar specifically, but disable zooming when any scrolling happens in an “axis area” next to a plot (which is where this colorbar happens to be): tools — Bokeh 3.3.2 Documentation
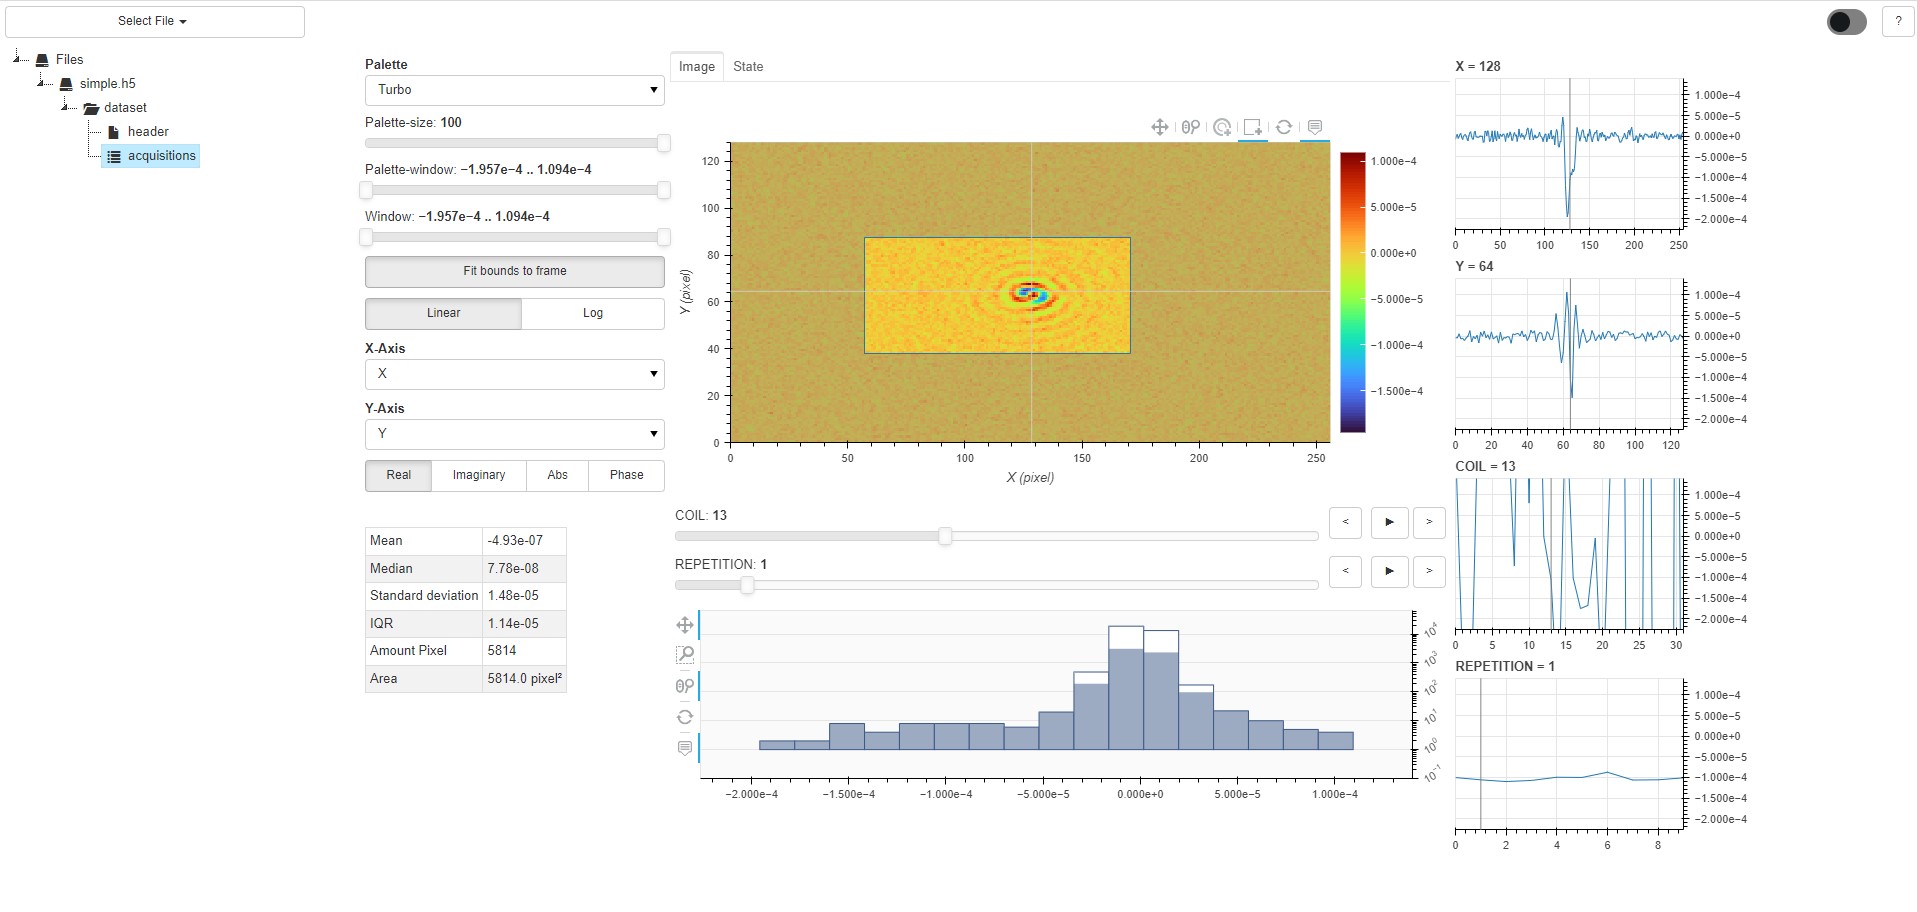
It has a decently comprehensive documentation to it and supports, among other things, displaying arbritary sizes of images of all kinds (extendable) with a regridding/downsampling functionality and also a selection tool on images.
This is where I would start looking (how the function is called and what it invokes):
This has been roughly 2 years ago and I have not touched the code since, so I can try to help further but not promise much. Keep in mind this is still bokeh 2.3.1. I am sure there have been a lot of breaking changes since.
@Bryan thanks for the help back then! Do you think it would still make sense to post this in the showcase-category, even though it is outdated? I remember that I have hacked a lot of functionality in that bokeh did not support back then, so it might still be somewhat useful for people trying to figure out how to make more complex things work.