Creating fibonacci retracement over candlestick graph

Hello, I would like to know how can i create Fibonacci retracement on candlestick graph. Below image show how exactly Fibonacci retracement looks like.
Users will select start point and drag till end point (i.e red dotted line in below image), those blue line will be created dynamically after user interaction.

fibo \

Thank You.

You can use the PolyDrawTool as described in this post and then you can respond to the updates it makes to the data source with standard js_on_change or (if this is a Bokeh server app) on_change methods.

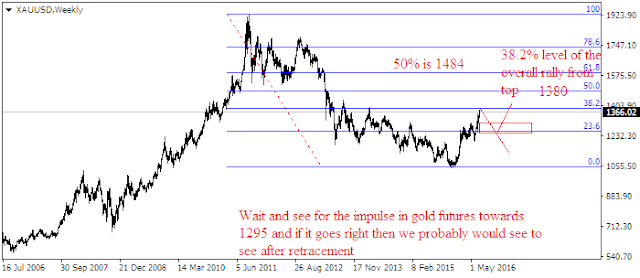
I have created a sample code. Please go through below code and guide me how I will get something similar to above image mention early in this post.

from bokeh.io import curdoc
from bokeh.plotting import figure, output_file, show
from bokeh.models import FreehandDrawTool, ColumnDataSource, Segment, CustomJS, Line, MultiLine

from bokeh.plotting import figure, output_file, show
from bokeh.models import PolyDrawTool, PolyEditTool

p = figure(x_range=(0, 10), y_range=(0, 10), width=400, height=400,
       title='Poly Edit Tool')


l1 = p.multi_line([], [], line_width =5, alpha= 0.4,  color='red', line_dash = 'dashed')
draw_tool_l1 = PolyDrawTool(renderers=[l1], num_objects=3)

source2= ColumnDataSource(data=dict(x=[], y=[], x1= [], y1= []))
source = ColumnDataSource(data=dict(x=[], y=[], x1= [], y1= []))
callback = CustomJS(args=dict(x_range = p.x_range,y_range =   p.y_range,source=source, source2 = source2), code="""
// the event that triggered the callback is cb_obj:
// The event type determines the relevant attributes
console.log('Tap event occurred at x-position: ' + cb_obj.x)
console.log('Tap event occurred at y-position: ' + cb_obj.y)
//var data = source.data;
x0 = cb_obj.x;
y0 = cb_obj.y;  
x30 = (x0*0.3) + x0;
y30 = (x0*0.3) + y0;     
source.data.x.push(x0);
source.data.y.push(y0);
source2.data.x30.push(x30);
source2.data.y30.push(y30);
source.data.y1.push(y0);                            
source2.data.y1.push(y0);                            
                    
source2.data.x1.push(y_range.max);                    
source.data.x1.push(y_range.max);


 console.log('x-position: ' + source2.data.x30);
 console.log('1x-position: ' + source.data.x);
console.log('y-position: ' + source2.data.y30);

console.log('x1-position: ' + source2.data.x1);
console.log('y1-position: ' + source2.data.y1);
source.change.emit();
""")
# execute a callback whenever the plot canvas is tapped
p.js_on_event('doubletap', callback)
s = Segment(x0='x',y0='y',x1='x1',y1='y1')
s1 = Segment(x0='x',y0='y',x1='x1',y1='y1')
s2 = Segment(x0='x30',y0='y30',x1='x1',y1='y1')
p.add_glyph(source, s, selection_glyph=s, nonselection_glyph=s)
p.add_glyph(source, s1, selection_glyph=s1, nonselection_glyph=s1)
p.add_glyph(source2, s2, selection_glyph=s2, nonselection_glyph=s2)
p.add_tools(draw_tool_l1)
p.toolbar.active_drag = draw_tool_l1
curdoc().add_root(p)

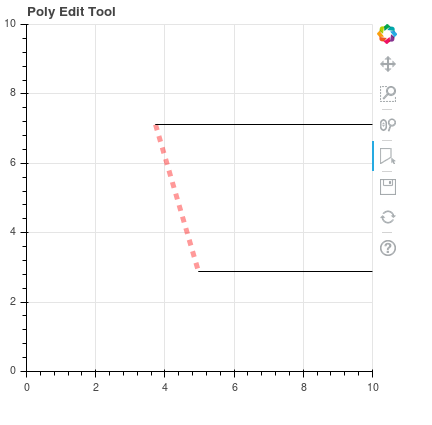
Output of given code , I am not getting extra segment “s2”, which uses “source2” CDS.

sample

Thank You.

As a gentle debugging tip, it is always a good first step to examine your data, to make sure that what is in it matches your expectations. After running, your code, it’s immediately observable that source2 is empty:

In [5]: source2.data
Out[5]: {'x': [], 'y': [], 'x1': [], 'y1': []}

More importantly, it does not have the x30 and y30 columns that you are trying to push values into in the JS callback. I can’t run your code because it is not complete, but I expect that there would be errors reported in the browser’s JavaScript console about this. My first suggestion is to add empty columns for those column names.

I have updated above code. Still, I am not getting extra segment “s2”, which uses “source2” CDS. Please go through below code and guide me how I will get segment s2.

from bokeh.io import curdoc
from bokeh.models import FreehandDrawTool, ColumnDataSource, Segment,       CustomJS, Line, MultiLine

from bokeh.plotting import figure
from bokeh.models import PolyDrawTool, PolyEditTool

p = figure(x_range=(0, 10), y_range=(0, 10), width=400, height=400,
       title='Poly Edit Tool')

l1 = p.multi_line([], [], line_width =5, alpha= 0.4,  color='red', line_dash = 'dashed')
draw_tool_l1 = PolyDrawTool(renderers=[l1], num_objects=3)
source= ColumnDataSource(data=dict(x=[], y=[], x1= [], y1= []))
source2 = ColumnDataSource(data=dict(x=[], y=[], x1= [], y1= []))
callback = CustomJS(args=dict(x_range = p.x_range,y_range = p.y_range,source=source, source2= source2), code="""
//console.log('Tap event occurred at x-position: ' + cb_obj.x)
//console.log('Tap event occurred at y-position: ' + cb_obj.y)
//var data = source.data;
x0 = cb_obj.x;
y0 = cb_obj.y;  
x30 = (x0*0.3) + x0;
y30 = (y0*0.3) + y0;     
source.data.x.push(x0);
source.data.y.push(y0);
source.data.y1.push(y0);
source.data.x1.push(y_range.max);

source2.data.x.push(x30);
source2.data.y.push(y30);                          
source2.data.y1.push(y0);                            
source2.data.x1.push(y_range.max);                    

console.log('x30-position: ' + source2.data.x); 
console.log('y30-position: ' + source2.data.y);
console.log('x1-position: ' + source2.data.x1);
console.log('y1-position: ' + source2.data.y1);
source.change.emit();

""")
 p.js_on_event('doubletap', callback)
 s = Segment(x0='x',y0='y',x1='x1',y1='y1')
 #s1 = Segment(x0='x',y0='y',x1='x1',y1='y1')
 s2 = Segment(x0='x',y0='y',x1='x1',y1='y1')
 p.add_glyph(source, s, selection_glyph=s, nonselection_glyph=s)
 #p.add_glyph(source, s1, selection_glyph=s1, nonselection_glyph=s1)
 p.add_glyph(source2, s2, selection_glyph=s2, nonselection_glyph=s2)
 p.add_tools(draw_tool_l1)
 p.toolbar.active_drag = draw_tool_l1
 curdoc().add_root(p)

You are not calling source2.change.emit(). Bokeh can only automagically detect changes from actual assignments, e.g. source.data = new_data. If you are updating the internals of some array by updating it in-place (as you are above) then it is always necessary to give the change hint (individually for each source this applies to)