Hello @Bryan,
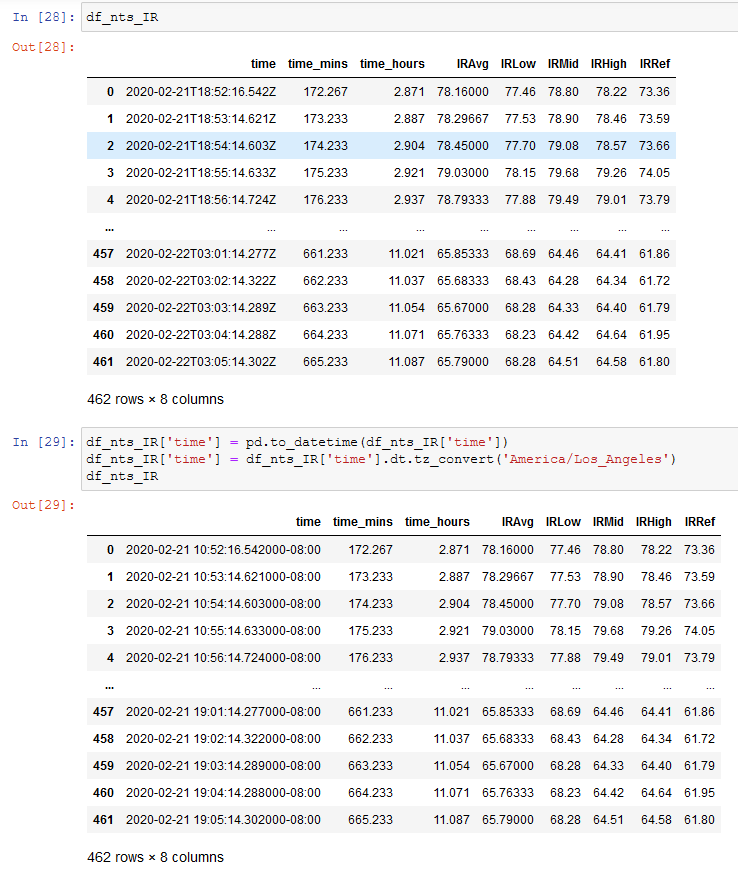
Here is an example. Looking at is it day? in NYC on Dec 20 2020, one of the shortest day of the year.
First row, I am passing the local time. Second row, I am passing UTC transformed to EST time. Code is below.
import pandas as pd
from bokeh.plotting import figure
from bokeh.models import ColumnDataSource, BoxAnnotation, Span, DatetimeTickFormatter
from bokeh.layouts import column, layout
from bokeh.io import show, output_file
from datetime import datetime
import time
import pytz

# import CSV file as a dataframe
df_is_it_day = pd.read_csv(".//NYC_shortest_day_is_it_day.csv")
df_is_it_day

# Convert time zone data
df_is_it_day['time_UTC'] = pd.to_datetime(df_is_it_day['time_UTC'])
df_is_it_day['time_local_EST_NYC'] = pd.to_datetime(df_is_it_day['time_local_EST_NYC'])
df_is_it_day['time_UTC'] = df_is_it_day['time_UTC'].dt.tz_convert('America/New_York')

# Setup Plot
output_file(".//vis_html//is_it_day_NYC.html")
TOOLS = "pan,wheel_zoom,box_zoom,reset,save,box_select,lasso_select"
data_source = ColumnDataSource(df_is_it_day)

# Is it Day in local time
plot_title = "Is it day?: in NYC local time."
local_time_figure = figure(tools=TOOLS, width=900, height=300, x_axis_type='datetime',
                                    title=plot_title)
local_time_figure.xaxis.axis_label = 'Time'
local_time_figure.yaxis.axis_label = 'Is it day?(-)'
local_time_figure.title.text_font_size = '16pt'
local_time_figure.axis.axis_label_text_font_size = '12pt'
local_time_figure.axis.major_label_text_font_size = '12pt'
local_time_figure.axis.major_label_text_font_style = 'bold'
local_time_figure.axis.axis_label_text_color = 'black'
local_time_figure.ygrid.minor_grid_line_color = 'gainsboro'

local_time_figure.circle('time_local_EST_NYC', 'is_it_day', source=data_source,
                            color='mediumblue', size=10, fill_alpha=0.8)

# Setup properties of figure handle
local_time_figure.xaxis.formatter=DatetimeTickFormatter(days="%m/%d %H:%M", months="%m/%d %H:%M",
                                                                    hours="%m/%d %H:%M", minutes="%m/%d %H:%M")

# Is it Day in UTC
plot_title = "Is it day?: in NYC local time."
UTC_time_figure = figure(tools=TOOLS, width=900, height=300, x_axis_type='datetime',
                                    title=plot_title)
UTC_time_figure.xaxis.axis_label = 'Time'
UTC_time_figure.yaxis.axis_label = 'Is it day?(-)'
UTC_time_figure.title.text_font_size = '16pt'
UTC_time_figure.axis.axis_label_text_font_size = '12pt'
UTC_time_figure.axis.major_label_text_font_size = '12pt'
UTC_time_figure.axis.major_label_text_font_style = 'bold'
UTC_time_figure.axis.axis_label_text_color = 'black'
UTC_time_figure.ygrid.minor_grid_line_color = 'gainsboro'

UTC_time_figure.circle('time_UTC', 'is_it_day', source=data_source,
                            color='mediumblue', size=10, fill_alpha=0.8)

# Setup properties of figure handle
UTC_time_figure.xaxis.formatter=DatetimeTickFormatter(days="%m/%d %H:%M", months="%m/%d %H:%M",
                                                                    hours="%m/%d %H:%M", minutes="%m/%d %H:%M")

# Add night time for Friday to Sunday
# Till Sunrise
start_time = (pd.to_datetime('20201220T0000').timestamp())*1000
end_time = (pd.to_datetime('20201220T0716').timestamp())*1000
morning_night_range = BoxAnnotation(left=start_time, right=end_time, fill_color='silver')
local_time_figure.add_layout(morning_night_range)
# Post Sunset
start_time = (pd.to_datetime('20201220T1631').timestamp())*1000
end_time = (pd.to_datetime('20201221T0000').timestamp())*1000
evening_night_range = BoxAnnotation(left=start_time, right=end_time, fill_color='silver')
local_time_figure.add_layout(evening_night_range)

show(column(local_time_figure, UTC_time_figure))
df_is_it_day
Data from CSV here:
time_UTC,time_local_EST_NYC,is_it_day
2020-12-20T05:00:00Z,2020-12-20T00:00:00,0
2020-12-20T06:00:00Z,2020-12-20T01:00:00,0
2020-12-20T07:00:00Z,2020-12-20T02:00:00,0
2020-12-20T08:00:00Z,2020-12-20T03:00:00,0
2020-12-20T09:00:00Z,2020-12-20T04:00:00,0
2020-12-20T10:00:00Z,2020-12-20T05:00:00,0
2020-12-20T11:00:00Z,2020-12-20T06:00:00,0
2020-12-20T12:00:00Z,2020-12-20T07:00:00,0
2020-12-20T13:00:00Z,2020-12-20T08:00:00,1
2020-12-20T14:00:00Z,2020-12-20T09:00:00,1
2020-12-20T15:00:00Z,2020-12-20T10:00:00,1
2020-12-20T16:00:00Z,2020-12-20T11:00:00,1
2020-12-20T17:00:00Z,2020-12-20T12:00:00,1
2020-12-20T18:00:00Z,2020-12-20T13:00:00,1
2020-12-20T19:00:00Z,2020-12-20T14:00:00,1
2020-12-20T20:00:00Z,2020-12-20T15:00:00,1
2020-12-20T21:00:00Z,2020-12-20T16:00:00,1
2020-12-20T22:00:00Z,2020-12-20T17:00:00,0
2020-12-20T23:00:00Z,2020-12-20T18:00:00,0
2020-12-21T00:00:00Z,2020-12-20T19:00:00,0
2020-12-21T01:00:00Z,2020-12-20T20:00:00,0
2020-12-21T02:00:00Z,2020-12-20T21:00:00,0
2020-12-21T03:00:00Z,2020-12-20T22:00:00,0
2020-12-21T04:00:00Z,2020-12-20T23:00:00,0