Div textbox scroll snap

Is there a way to make a scrolling div textbox snap to the end and stay there when new text is added?

I’d like to have additional text come into the scrolling textbox and have it be displayed rather than forcing the user to use the scrollbar to scroll down. The point of the scrollbar is to keep useful output available for debugging.

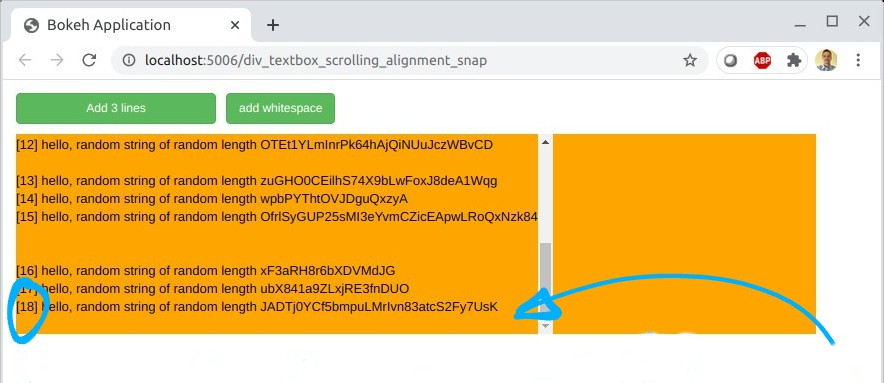
But if the new text arrives at the bottom and is not visible by default, it forces the user to scroll down to see the most recent. Backwards is a little confusing. New text should enter at the bottom and be immediately visible.

An example with a scrollbar is from here. The following bokeh serve example illustrates the issue.

Run with:
bokeh serve --show div_textbox_scrolling_alignment_snap.py

Filename div_textbox_scrolling_alignment_snap.py:

from bokeh.layouts import column, layout, row
from bokeh.io import curdoc
from bokeh.models import Button
from bokeh.models.widgets import Div

from collections import deque
import subprocess
import sys
from queue import Queue

import random
import string

console_output_lines = 10
style_dict={'overflow-y':'scroll','height':'{0}px'.format(20*console_output_lines)}
web_console_div = Div(text='', width=800, height=20*console_output_lines, background='orange', style=style_dict)

def random_str(len=10):
    return ''.join(random.sample( string.ascii_lowercase + string.ascii_uppercase + string.digits, len))

doc=curdoc() # make a copy so bokeh server and thread use same curdoc()

qProcLine=Queue()
msg_list = deque([])
def print_subproc_output():
    global msg_list
    msg_list.append( qProcLine.get() )
    m=''
    for msg in msg_list:
        m += '{0}<br>'.format(msg)
    web_console_div.text = m

# -----------------------------------------------------------------------------
cnt=0
def bt_add_lines_callback():
    global cnt
    for line in range(3):
        cnt+=1
        qProcLine.put( '[{0}] hello, random string of random length {1}'.format(cnt,random_str( int(random.uniform(10,40)) )) )
        doc.add_next_tick_callback(print_subproc_output)

bt_add_lines = Button(label="Add 3 lines" , button_type="success", width=200)
bt_add_lines.on_click(bt_add_lines_callback)

# -----------------------------------------------------------------------------
def add_whitespace():
    qProcLine.put( ' ' )
    doc.add_next_tick_callback(print_subproc_output)

bt_space = Button(label="add whitespace" , button_type="success", width=50)
bt_space.on_click(add_whitespace)


## arrange all map views in a grid layout then add to the document
layout = layout([
    [bt_add_lines,bt_space],
    [web_console_div] ])#, sizing_mode='fixed') # "fixed", "stretch_both", "scale_width", "scale_height", "scale_both"


doc.add_root(layout)

Screenshot 1 illustrating the issue:

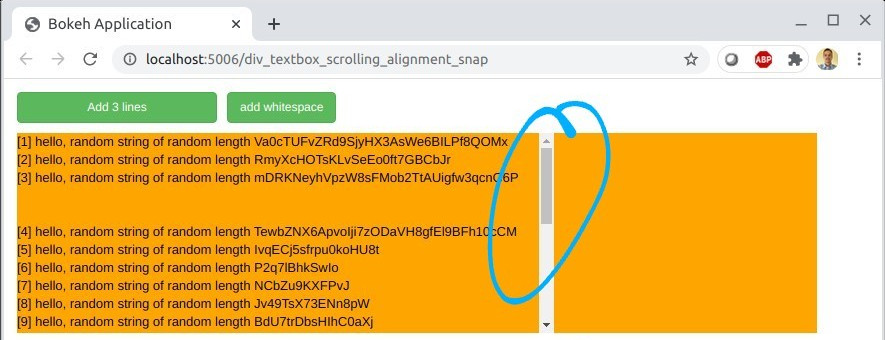
Screenshot 2 illusrating the question:

@comperem

I do not see a way to accomplish this through a bokeh Div model wrapper to an HTML div.
It might be possible if you were to make a custom model using typescript or Javascript to extend Div, but no guarantees if that would work or how involved it would be.

If you’re not committed to using Div, you might be able to achieve some of what you want using other bokeh models, like a DataTable, for example. The following can be run via bokeh serve as a simple example of updating programmatically scrolling to the bottom of the information by setting the selected indices. NB: This simple example has a bit of lag to its update, but it does actively “jump-scroll” to the end.

#!/usr/bin/env python3
# -*- coding: utf-8 -*-
"""
"""
from datetime import datetime

from bokeh.plotting import curdoc
from bokeh.models import ColumnDataSource, DataTable, TableColumn, StringEditor

data = dict(index=[], info=[])
source = ColumnDataSource(data=data)

t = DataTable(source=source,
              columns=[TableColumn(field="info", title="Debug Console", editor=StringEditor())],
              width=400, height=300)

ii = 0

def cb():
    global ii

    data = dict(index=[ii], info=["INFO ts: {:}".format(datetime.now())])
    source.stream(data, 100)
    source.selected.indices = [ii]

    ii += 1


D = curdoc()
D.add_root(t)

D.add_periodic_callback(cb, 1000)

Ok @_jm, thank you for the working example.

It’s functional, mostly. I’m not tied to the DIV box, so DataTable is just fine. The code is clean and simple and the stream method is convenient and efficient especially with the rollover parameter to limit the total text. Using a periodic callback for a text box placement was not what I was expecting.

Runtime execution is a little clunky and it snaps to the top after 100 iterations. Reducing callback time to 100ms reveals this behavior after 100 lines.

It’s ok. The jumpy slider bar is a little distracting. It’s not quite perfect.

@comperem

As you note, I figured the data table was possibly a nice option bc (i) it supports streaming and (ii) the rollover via the maximum size of retained data acts a lot like a buffer size that one sees in the scroll/retention of a terminal window, for example.

Regarding the following, …

I see. I think this is b/c my simple example was too simple. It likely has to do with my callback allowing the index ii to grow unbounded but the table being limited to 100 elements by virtue of the rollover parameter that limits the buffer size of the retained info.

I was just trying to illustrate by example the components that could go into a solution. The periodic callback was something that enabled a relatively small example to quickly generate artificial text not intended as an implementation detail that would make sense in your specific or any general use case.

Similarly, the organization and use of global variables, etc. is not something I would do in a real implementation, but it enabled a smallish example. Just details for brevity-of-example sake.

Hello @_jm,

The periodic callback is not how I would use this so I’ve put the buttons back in. This console text output is to capture stdout and stderr from launched processes which will come in bursts, then stop. So the distracting motion is removed without the periodic callback. The buttons make it much more usable for my purposes.

By the way, globals are just fine in simple sketches. I use them all the time and routinely reject the assertion that globals are bad. They’re just fine when used in isolated, simple scripts that are, indeed, real, as you say. Ha.

Thanks for your help. The rollover parameter works great. Super clean. I really like it.

Run with:

bokeh serve --show scrollable_console_with_DataTable_2.py

And the updated script:

from datetime import datetime
from queue import Queue
from collections import deque

from bokeh.layouts import column, layout, row
from bokeh.plotting import curdoc
from bokeh.models import ColumnDataSource, DataTable, TableColumn, StringEditor, Button

import random
import string

def random_str(len=10):
    return ''.join(random.sample( string.ascii_lowercase + string.ascii_uppercase + string.digits, len))

doc=curdoc() # make a copy so bokeh server and thread use same curdoc()

data = dict(index=[], info=[])
source = ColumnDataSource(data=data)

t = DataTable(source=source,
              columns=[TableColumn(field="info", title="Debug Console", editor=StringEditor())],
              width=800, height=300)

ii = 0

# -----------------------------------------------------------------------------
qProcLine=Queue()
msg_list = deque([])
def print_subproc_output():
    global ii
    data = dict(index=[ii], info=["new string: {:}".format(qProcLine.get())])
    source.stream(data, 100)
    source.selected.indices = [ii] # snap to bottom DataTable cell
    if ii<99:
        ii += 1
    

# -----------------------------------------------------------------------------
cnt=0
def bt_add_lines_callback():
    global cnt
    for line in range(5):
        cnt+=1
        qProcLine.put( '[{0}] hello, random string of random length {1}'.format(cnt,random_str( int(random.uniform(10,40)) )) )
        doc.add_next_tick_callback(print_subproc_output) # update web console; technique from: https://stackoverflow.com/a/60745271/7621907

bt_add_lines = Button(label="Add 5 lines" , button_type="success", width=200)
bt_add_lines.on_click(bt_add_lines_callback)

# -----------------------------------------------------------------------------
def add_whitespace():
    global cnt
    cnt+=1
    qProcLine.put( '[{0}]'.format(cnt) )
    doc.add_next_tick_callback(print_subproc_output) # update web console; technique from: https://stackoverflow.com/a/60745271/7621907

bt_space = Button(label="add whitespace" , button_type="success", width=50)
bt_space.on_click(add_whitespace)


## arrange all map views in a grid layout then add to the document
layout = layout([
    [bt_add_lines,bt_space],
    [t] ])#, sizing_mode='fixed') # "fixed", "stretch_both", "scale_width", "scale_height", "scale_both"


D = curdoc()
D.add_root(layout)

Bottom of DataTable shows most recent console output:

Top of DataTable: