For loop color picker add to html table? Possible?

Hi,

I have added a snippet of code below. I was wondering if its possible to add the ColorPicker model inside the table for each zone? And the user selects what color it wants to use. If its not possible to add it inside the html text. Is there a way to add it in a loop? I forsee my project having maybe up to 20 different zones and user wants to be able to manually select what color the line or marker should be.
Hope someone can help or point me in a direction.

from bokeh.io import show
from bokeh.layouts import column
from bokeh.models import ColorPicker, Div
from bokeh.plotting import Figure

plot = Figure(x_range=(0, 1), y_range=(0, 1), width=350, height=350)
systems = ['Zone-1', 'Zone-2', 'Zone-3']
values = [1, 2, 3]
colors = ['red', 'blue', 'green']

htmltext = Div(text = """
<!DOCTYPE html>
<html>
<head>
<style>
table {
  border-collapse: collapse;
  width: 100%;
}

th, td {
  text-align: left;
  padding: 8px;
}

tr:nth-child(even) {
  background-color: #D6EEEE;
}
</style>
</head>
<body>

<h2>Change color for respectives zones below:</h2>
<table>
  <tr>
    <th>Zone</th>
    <th>Color Picker</th>
  </tr>
  <tr>
    <td>Zone-1</td>
    <td>Colorpicker</td>
  </tr>
  <tr>
    <td>Zone-2</td>
    <td>Colorpicker</td>
  </tr>
  <tr>
    <td>Zone-3</td>
    <td>Colorpicker</td>
  </tr>
</table> 
</body>
</html>             
""", width = 400, height = 300, style={'font-size': '100%', 'color': 'black'})


def plotter(systems, colors):
    for name, color, val in zip(sorted(systems), colors, values):
        print(name, color, val)
        line = plot.line(x=(0,val + 1), y=(0,1), color=color, line_width=4, legend_label = name)
        picker = ColorPicker(title=name)
        picker.js_link('color', line.glyph, 'line_color')
    
    return line, picker

line, picker =  plotter(systems, colors)
show(column(plot, htmltext, picker))
1 Like

“I was wondering if its possible to add the ColorPicker model inside the table for each zone”

I don’t know the answer to that, if anything I imagine embedding fully functional models within a datatable would take some tricky html/css work. I am following this with interest though as an example showing how to do this would very likely be of use to me too.

“If its not possible to add it inside the html text. Is there a way to add it in a loop?”

Of course! Your function basically already does this. What’s missing is a means of returning all the things being created within it.

So basically going back to the dictionary-organization-type setup I showed you in a previous post (I think that was you), the idea is to build a dictionary storing all the stuff you might need to call on when building your layout:

#probably want to add the figure to this function as well in case you want to add stuff to different figures
def plotter(fig,systems, colors):
    plot_dict = {} #use this dictionary to store/organize stuff
    #basically going for this kind of structure: 
        # name/system as keys, each key holding another dictionary pointing to 'fig':thefigureitsplottedon, 'rend':thelinerenderer, and 'picker':itscorrespondingcolorpicker
    for name, color, val in zip(sorted(systems), colors, values):
        print(name, color, val)
        line = fig.line(x=(0,val + 1), y=(0,1), color=color, line_width=4, legend_label = name)
        picker = ColorPicker(title=name,color=color) #added color arg here to properly initialize
        picker.js_link('color', line.glyph, 'line_color')
        plot_dict[name] = {}
        plot_dict[name]['fig'] = fig
        plot_dict[name]['rend'] = line
        plot_dict[name]['picker'] = picker
    return plot_dict

   
plot_dict =  plotter(plot,systems, colors)
#now just use plot dict to organize a layout/column
lo = column([plot,htmltext]+[plot_dict[k]['picker'] for k in plot_dict.keys()])
show(lo)
2 Likes

Thanks for the help! That is a super nice solution.

Hei,

I tried adding the color picker to the data_table in bokeh, added it to the html formatter. I am a little stuck. Colors show up as black. Not sure why. You think its possible to link it somehow? (see example below).

from bokeh.io import show
from bokeh.layouts import column, row
from bokeh.models import ColorPicker, Div, HTMLTemplateFormatter, ColumnDataSource, TableColumn, DataTable
from bokeh.io import curdoc
from bokeh.plotting import figure, output_file, show

output_file("dark_minimal.html")
#curdoc().theme = 'dark_minimal'

plot = figure(x_range=(0, 1), y_range=(0, 1), width=350, height=350)
systems = ['Zone-1', 'Zone-2', 'Zone-3']
values = [1, 2, 3]
colors = ['#18e7b9','#520084','#d2d200']

htmltext = Div(text = """
<!DOCTYPE html>
<html>
<head>
<style>
table {
  border-collapse: collapse;
  width: 100%;
}

th, td {
  text-align: left;
  padding: 8px;
}

</style>
</head>
<body>
<h2>Change color for respectives zones below:</h2>
</body>
</html>             
""", width = 400, height = 300, style={'font-size': '100%', 'color': 'black'})

template="""                
            <span class="bk bk-input-group"> 
            <input class="bk bk-input" type="color" value = <%= value %>> 
            </span>
            """

formatter =  HTMLTemplateFormatter(template=template)

def plotter(fig,systems, colors):
    plot_dict = {} #use this dictionary to store/organize stuff
    #basically going for this kind of structure: 
        # name/system as keys, each key holding another dictionary pointing to 'fig':thefigureitsplottedon, 'rend':thelinerenderer, and 'picker':itscorrespondingcolorpicker
    for name, color, val in zip(sorted(systems), colors, values):
        print(name, color, val)
        line = fig.line(x=(0,val + 1), y=(0,1), color=color, line_width=4, legend_label = name)
        picker = ColorPicker(title=name,color=color) #added color arg here to properly initialize
        picker.js_link('color', line.glyph, 'line_color')
        plot_dict[name] = {}
        plot_dict[name]['fig'] = fig
        plot_dict[name]['rend'] = line
        plot_dict[name]['picker'] = picker
    return plot_dict


source = ColumnDataSource(data = dict(
    systems=systems,
    values = values,
    colors = colors,
))

columns = [TableColumn(field="systems", title="System Number", width = 200),
           TableColumn(field='colors', title='color', formatter=formatter, width=500),
           #TableColumn(field='plotdict', title='color picker', formatter=formatter, width=500)           
          ]
data_table = DataTable(source=source,
                       columns=columns,
                       fit_columns=True,
                       selectable = True,
                       sortable = True,
                       width=400,height=400)
#show(data_table)
plot_dict =  plotter(plot,systems, colors)
#now just use plot dict to organize a layout/column
#lo = row(plot, column([htmltext]+ [plot_dict[k]['picker'] for k in plot_dict.keys()]))
lo = row(plot, column([data_table] + [plot_dict[k]['picker'] for k in plot_dict.keys()]))

show(lo)
1 Like

Very nice. I think you are very close (and I’m frustrated because I can’t really help you further because this pretty beyond my level i.e. I know so little html/css it’s not even funny).

I played with your code a bit, and can maybe offer a few clues:

If you change the source driving your table to:

source = ColumnDataSource(data = dict(
    systems=systems,
    values = values,
    colors = [plot_dict[k]['picker'] for k in plot_dict.keys()], #actually passing in the pickers here
))

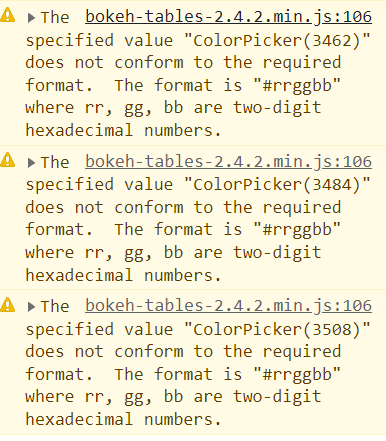
You get black colors like you mentioned. But loading the JS console in the browser shows:

image

Which tells me it’s defaulting to black because (I think) the template isn’t structured to actually read the hex color field from the colorpicker? No idea how to remedy. The jslink doesn’t seem to be maintained either and I have no idea how to go about that even investigating that :frowning:

Sorry I can’t help further, maybe my clue will help or someone else will chime in. I’m super interested to see a solution to this - it’d open up a lot of ideas for me too.

1 Like

I’ll have to look a little more into it.
I really liked your solution with the plot dict. I was wondering if it was possible to make buttons that are inside the for loop and have it plot the area under the graph individually for each curve.
You can see in the example below I have to add the zone, but how can I link to the correct button being pressed to calculate the area? Do you have an idea, or is it not possible?

from bokeh.io import show
from bokeh.layouts import column, row
from bokeh.models import ColorPicker, Div, HTMLTemplateFormatter, ColumnDataSource, TableColumn, DataTable, TextInput, Button
from bokeh.io import curdoc
from bokeh.plotting import figure, output_file, show
import numpy as np
from numpy import trapz
import pandas as pd

output_file("dark_minimal.html")
#curdoc().theme = 'dark_minimal'

plot = figure(width=350, height=350)

d = {'systems': ['Zone-1', 'Zone-2', 'Zone-3'], 
     'colors': ['#18e7b9','#520084','#d2d200'],
     'power': [1.25, 1.5, 1.75]
    }
df = pd.DataFrame(data=d, index = [0, 1, 2])

template="""                
            <span class="bk bk-input-group"> 
            <input class="bk bk-input" type="color" value = <%= value %>> 
            </span>
            """

formatter =  HTMLTemplateFormatter(template=template)

def getData(val, tstart = 0, tend = 10):
    x = np.arange(tstart, tend, 1)
    y = val**x 
    return x, y

def plotter(fig, df):
    plot_dict = {} #use this dictionary to store/organize stuff
    #basically going for this kind of structure: 
    #name/system as keys, each key holding another dictionary pointing to 'fig':thefigureitsplottedon, 'rend':thelinerenderer, and 'picker':itscorrespondingcolorpicker
    for name, color, val in zip(sorted(df.systems), df.colors, df.power):
        print(name, color, val)
        x, y = getData(val)
        
        line = fig.line(x=x, y=y, color=color, line_width=4, legend_label = name)
        
        picker = ColorPicker(title=name,color=color) #added color arg here to properly initialize
        tstart = TextInput(value="0", title="Start time", width = 200)
        tend = TextInput(value="10", title="End time", width = 200)
        drawButton = Button(label="Calculate Area under graph", button_type="success")

        picker.js_link('color', line.glyph, 'line_color')
        plot_dict[name] = {}
        plot_dict[name]['fig'] = fig
        plot_dict[name]['rend'] = line
        plot_dict[name]['picker'] = picker
        plot_dict[name]['tstart'] = tstart
        plot_dict[name]['tend'] = tend
        plot_dict[name]['drawButton'] = drawButton
        
        drawButton.on_click(drawArea)
        
    return plot_dict

def fillColorUndercurve(x, y, plot, tstart, tend, Zone, color):
    print(tstart.value, tend.value)
    area = trapz(y, x, dx=5)
    print("area =", area)
    plot.circle_cross(x, y ,
                      size = 7,
                      legend_label = Zone + ', Area = ' + str(round(area, 2)) + ' mg',
                              color=color,
                              fill_alpha = 1)
    plot.varea(x = x, 
               y1 = 0.000000000000000000001, 
               y2 = y, 
               legend_label = Zone + ', Area = ' + str(round(area, 2)) + ' mg',
               fill_color = color)
    plot.legend.click_policy = 'hide'
    
    return plot

def drawArea(event):
    Zone = 'Zone-1'
    tstart = plot_dict[Zone]['tstart']
    tend = plot_dict[Zone]['tend']
    print(tstart, tend)

    x, y = getData(val = df.power[0], tstart = float(tstart.value), tend = float(tend.value))
    color = df.colors[0]
    fillColorUndercurve(x, y, plot, tstart, tend, Zone, color)
    
plot_dict =  plotter(plot,df)
plot_dict['Zone-1']['drawButton'].on_click(drawArea)
#now just use plot dict to organize a layout/column
#layout = [column(plot_dict[k]['tstart'], plot_dict[k]['tend'], plot_dict[k]['drawButton']) for k in plot_dict.keys()]
lo = row(plot, column([column(plot_dict[k]['picker'], plot_dict[k]['tstart'], plot_dict[k]['tend'], plot_dict[k]['drawButton']) for k in plot_dict.keys()]))

#show(lo)
curdoc().add_root(lo)

This topic was automatically closed 90 days after the last reply. New replies are no longer allowed.