Hi, I saw some peeps had trouble getting durations ( TimeDelta ) nicely rendered in the axis, as the only option so far is the NumeralTickFormatter(format="00:00:00") rendering, which doesn’t scale well at all.
- Need help formatting axis for duration
- Better handling of timedelta · Issue #7867 · bokeh/bokeh · GitHub
- StackOverflow question 73001737 about hvplot-holoviews-bokeh-timedelta-axis-with-negative-values-formatter ( uses Python code from hvplot ?? new users have a 2 link limit
 )
)
After a few tries I managed to get something OK.
plot.yaxis.ticker = DatetimeTicker()
plot.yaxis.formatter = FuncTickFormatter(code=jscode)
Here is my JS code, using the Date parser to do most of the job.
const date = new Date(tick);
const datevalues = [
   date.getFullYear() - 1970,
   date.getMonth(),
   date.getDate() -1,
   date.getHours(),
   date.getMinutes(),
   date.getSeconds(),
];
var r = "";
const datenames = ["y","m","d","h","m","s"];
var started = false;
for (var i = 0;i < 6;i = i + 1) {
    if ((started == true) || (datevalues[i] !== 0)) {
        r += " "+datevalues[i]+datenames[i];
        started = true;
    }
}
return r;
The result is pretty cool, I included bugged negative offsets ( you might want to handle the -1y bug if you get negative timedelta values ) so that you can see what a really long delta might look like. It’s nothing big and professional, but heh,
- timedelta :
4864864s "00:00:00"rendering :1351:21:04- this rendering :
1m 26d 7h 21m 4s
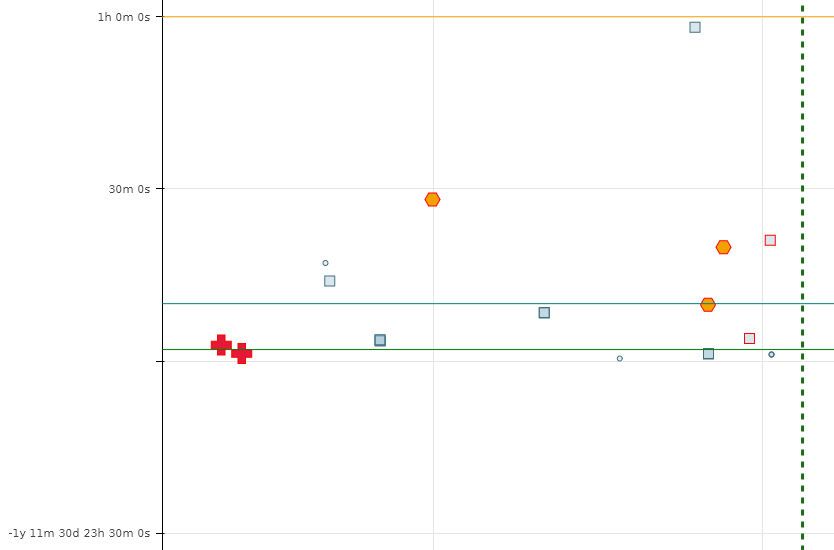
I find this cooler. What really helps here is notably the DatetimeTicker which has good defaults. Both the issue & the help topics are closed, so here’s a fresh post. Thanks for building such a nice library !