Hello, I have a hard time finding a solution to exclude some empty parts of my graph in bokeh 1.4.0.
First take a look at the graph:
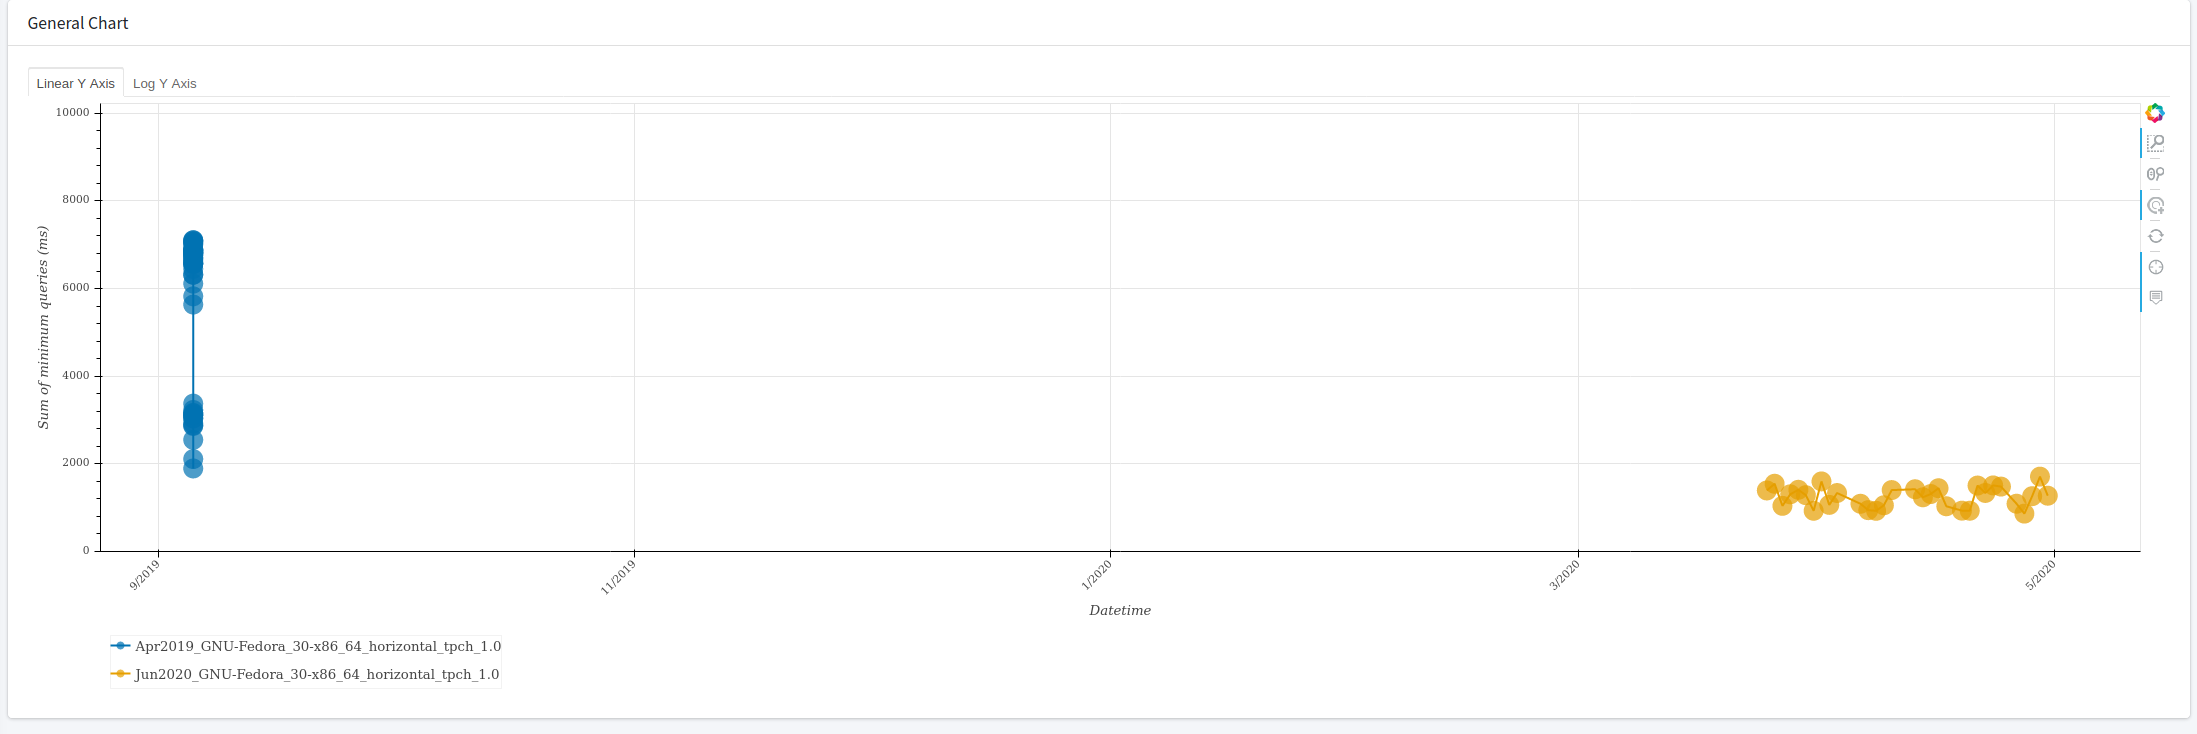
There is a large empty space between the two plots.
These are the interesting parts of my code:
source = ColumnDataSource(
        dict(x=x, y=y, label=benchmark, changeset=changeset,
             group_by=group_by, url_params=url_params))


p = figure(tools=TOOLS,
                x_axis_type='datetime',
                x_axis_label='Datetime',
                y_axis_type=y_axis_type,
                y_range=y_range,
                y_axis_label=y_axis_label,
                sizing_mode="stretch_both")

p.xaxis.formatter = DatetimeTickFormatter(
        milliseconds=['%Y-%m-%d %H:%M:%S.%3N'],
        seconds=["%Y-%m-%d %H:%M:%S"],
        minsec=["%Y-%m-%d %H:%M:%S"],
        minutes=["%Y-%m-%d %H:%M:%S"],
        hourmin=["%Y-%m-%d %H:%M:%S"],
        hours=["%Y-%m-%d %H:%M:%S"],
        days=["%Y-%m-%d %H:%M:%S"],
        months=["%Y-%m-%d %H:%M:%S"],
        years=["%Y-%m-%d %H:%M:%S"]
    )
p.xaxis.major_label_orientation = pi / 4

p.xaxis.major_label_overrides = {
            i: date.strftime('%Y-%m-%d %H:%M:%S') for i, date in enumerate(x)
        }
I have tried a similar approach to:
How do I make omit missing dates gaps in graph when using datetime as x-axis
but it doesn’t seem to work.
The data in p.xaxis.major_label_overrides are equal to:
{0: '2019-09-05 11:28:25', 1: '2019-09-05 11:28:25', 2: '2019-09-05 11:28:25', 3: '2019-09-05 11:28:26', 4: '2019-09-05 11:28:26', 5: '2019-09-05 11:28:26', 6: '2019-09-05 11:28:26', 7: '2019-09-05 11:28:26', 8: '2019-09-05 11:28:26', 9: '2019-09-05 11:28:26', 10: '2019-09-05 11:28:26', 11: '2019-09-05 11:28:26', 12: '2019-09-05 11:28:26', 13: '2019-09-05 11:28:26', 14: '2019-09-05 11:28:26', 15: '2019-09-05 11:28:26', 16: '2019-09-05 11:28:26', 17: '2019-09-05 11:28:26', 18: '2019-09-05 11:28:26', 19: '2019-09-05 11:28:26', 20: '2019-09-05 11:28:26', 21: '2019-09-05 11:28:26', 22: '2019-09-05 11:28:26', 23: '2019-09-05 11:28:26', 24: '2019-09-05 11:28:26', 25: '2019-09-05 11:28:26', 26: '2019-09-05 11:28:26', 27: '2019-09-05 11:28:26', 28: '2019-09-05 11:28:26', 29: '2019-09-05 11:28:26', 30: '2019-09-05 11:28:26', 31: '2019-09-05 11:28:27', 32: '2019-09-05 11:28:27', 33: '2019-09-05 11:28:27', 34: '2019-09-05 11:28:27', 35: '2019-09-05 11:28:27', 36: '2019-09-05 11:28:27', 37: '2019-09-05 11:28:27', 38: '2019-09-05 11:28:27', 39: '2019-09-05 11:28:27', 40: '2019-09-05 11:28:27', 41: '2019-09-05 11:28:27', 42: '2019-09-05 11:28:27', 43: '2019-09-05 11:28:27', 44: '2019-09-05 11:28:27', 45: '2019-09-05 11:28:27', 46: '2019-09-05 11:28:27', 47: '2019-09-05 11:28:27', 48: '2020-03-25 02:44:18', 49: '2020-03-26 02:44:40', 50: '2020-03-27 02:46:48', 51: '2020-03-28 02:45:58', 52: '2020-03-29 03:45:20', 53: '2020-03-30 02:47:09', 54: '2020-03-31 02:46:20', 55: '2020-04-01 02:48:40', 56: '2020-04-02 02:46:57', 57: '2020-04-03 02:45:12', 58: '2020-04-06 02:46:22', 59: '2020-04-07 02:45:21', 60: '2020-04-08 02:51:35', 61: '2020-04-09 02:45:40', 62: '2020-04-10 02:46:22', 63: '2020-04-13 02:45:26', 64: '2020-04-14 02:44:30', 65: '2020-04-15 02:45:55', 66: '2020-04-16 02:47:15', 67: '2020-04-17 02:46:08', 68: '2020-04-19 02:48:13', 69: '2020-04-20 02:46:27', 70: '2020-04-21 02:45:39', 71: '2020-04-22 02:47:06', 72: '2020-04-23 02:50:58', 73: '2020-04-24 02:47:09', 74: '2020-04-26 02:44:59', 75: '2020-04-27 02:50:34', 76: '2020-04-28 02:46:28', 77: '2020-04-29 02:46:34', 78: '2020-04-30 02:44:52'}