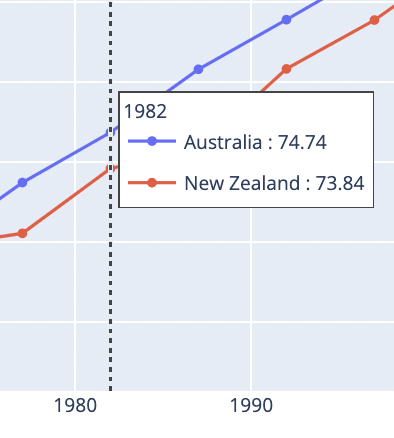
To quickly analyze the data in my charts, I need to see all the values of a multi-line chart at once.
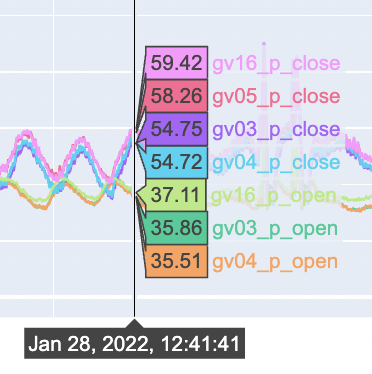
My first idea (and preferred solution) was to display the values of the current cursor position (vline) next to the labels. Unfortunately, I can’t get this to work with JavaScript.
It’s also a challenge with the hover tool. Maybe someone can help?
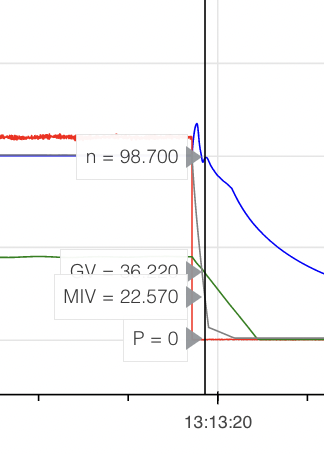
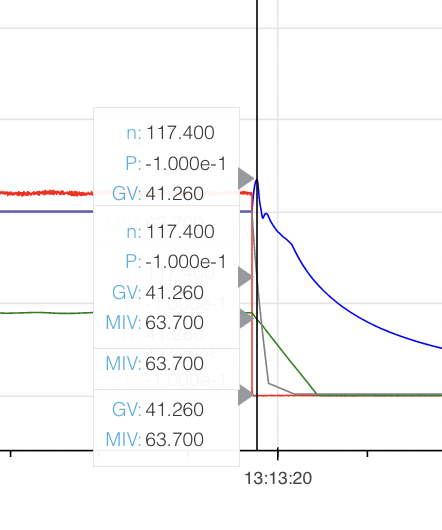
1. try: One hovertool for each line in the plot is nice, as the arrow points to the data point, but if the lines are close to each other it is useless, as they overlap.
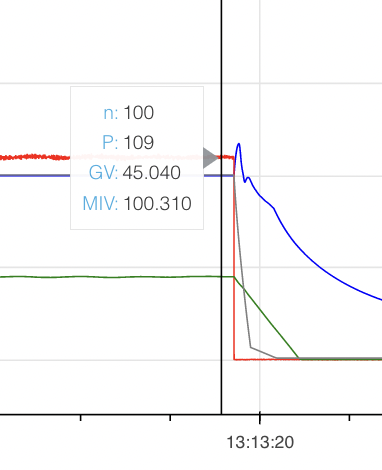
2. try: All data in one hovetool is cumbersome since I need to point exactly on a line to see the label.
I would suggest trying the second approach (unified hover label) with mode="vline" on the hover tool to make hit-testing more generous. You might also then want to restrict the hover tool to only one of the glyph renderers, though.
There might also be some CSS tricks that could be updated/adapted from this old issue:
But note that would require some experimentation. I do still think the hover tool needs improvements like an automatic visual dodge [1], but it just has not out-competed other priorities. It would be an interesting project for a motivated new contributor, and I am happy to mentor anyone who wants to dive into it.