Here’s my homebrew example:
from bokeh.models import CustomJS, Line, ColumnDataSource, Legend, LegendItem, Span
from bokeh.plotting import figure, save
from bokeh.events import MouseMove

data = {'x':[1,2,3,4,5,6,7],'y':[3,5,6,6,8,10,13]}
src = ColumnDataSource(data)
f = figure()
glyph = Line(x='x',y='y')
rend = f.add_glyph(src,glyph)
#create legend manually
leg_items = [LegendItem(label='Thing: ',renderers=[rend],index=0)]
leg = Legend(items=leg_items)
f.add_layout(leg)

#create spans to follow your mouse
vert = Span(location=0, dimension='height', line_color='black',line_dash='solid', line_width=1)
f.add_layout(vert)
horz = Span(location=0, dimension='width', line_color='black',line_dash='solid', line_width=1)
f.add_layout(horz)

#custom callback to trigger on mouse move, passing the things we need for it
#the legend items, the datasource, the base label, and the spans
cb = CustomJS(args=dict(leg_items=leg_items,src=src,lbl='Thing: ',vert=vert,horz=horz)
              ,code='''
              //update the spans to current mouse location
              vert.location = cb_obj.x
              horz.location = cb_obj.y
              var x = cb_obj.x
              //going through the length of your data source -1
              for (var i=0; i<src.data['x'].length-1;i++){
                      //if the mouse location x is between the source x and the next x...
                      if (x > src.data['x'][i] && x < src.data['x'][i+1]){
                              //linear interp math --> find in between the two x's
                              var m = (src.data['y'][i+1]-src.data['y'][i])/(src.data['x'][i+1]-src.data['x'][i])
                              var y = (m*(src.data['x'][i+1]-x)-src.data['y'][i+1])*-1
                              //update legend item label
                              leg_items[0].label = lbl+y.toFixed(2).toString()
                              //once this is done no point in continuing loop so break it
                              break}
                      }
              ''')
#when user moves mouse over figure, trigger this callback
f.js_on_event(MouseMove,cb)
save(f,'dummy.html')
Plenty of “efficiency”/scaling to have with multiple legend items etc and/or if you’re using multiline but hopefully this is enough to set you on your way.
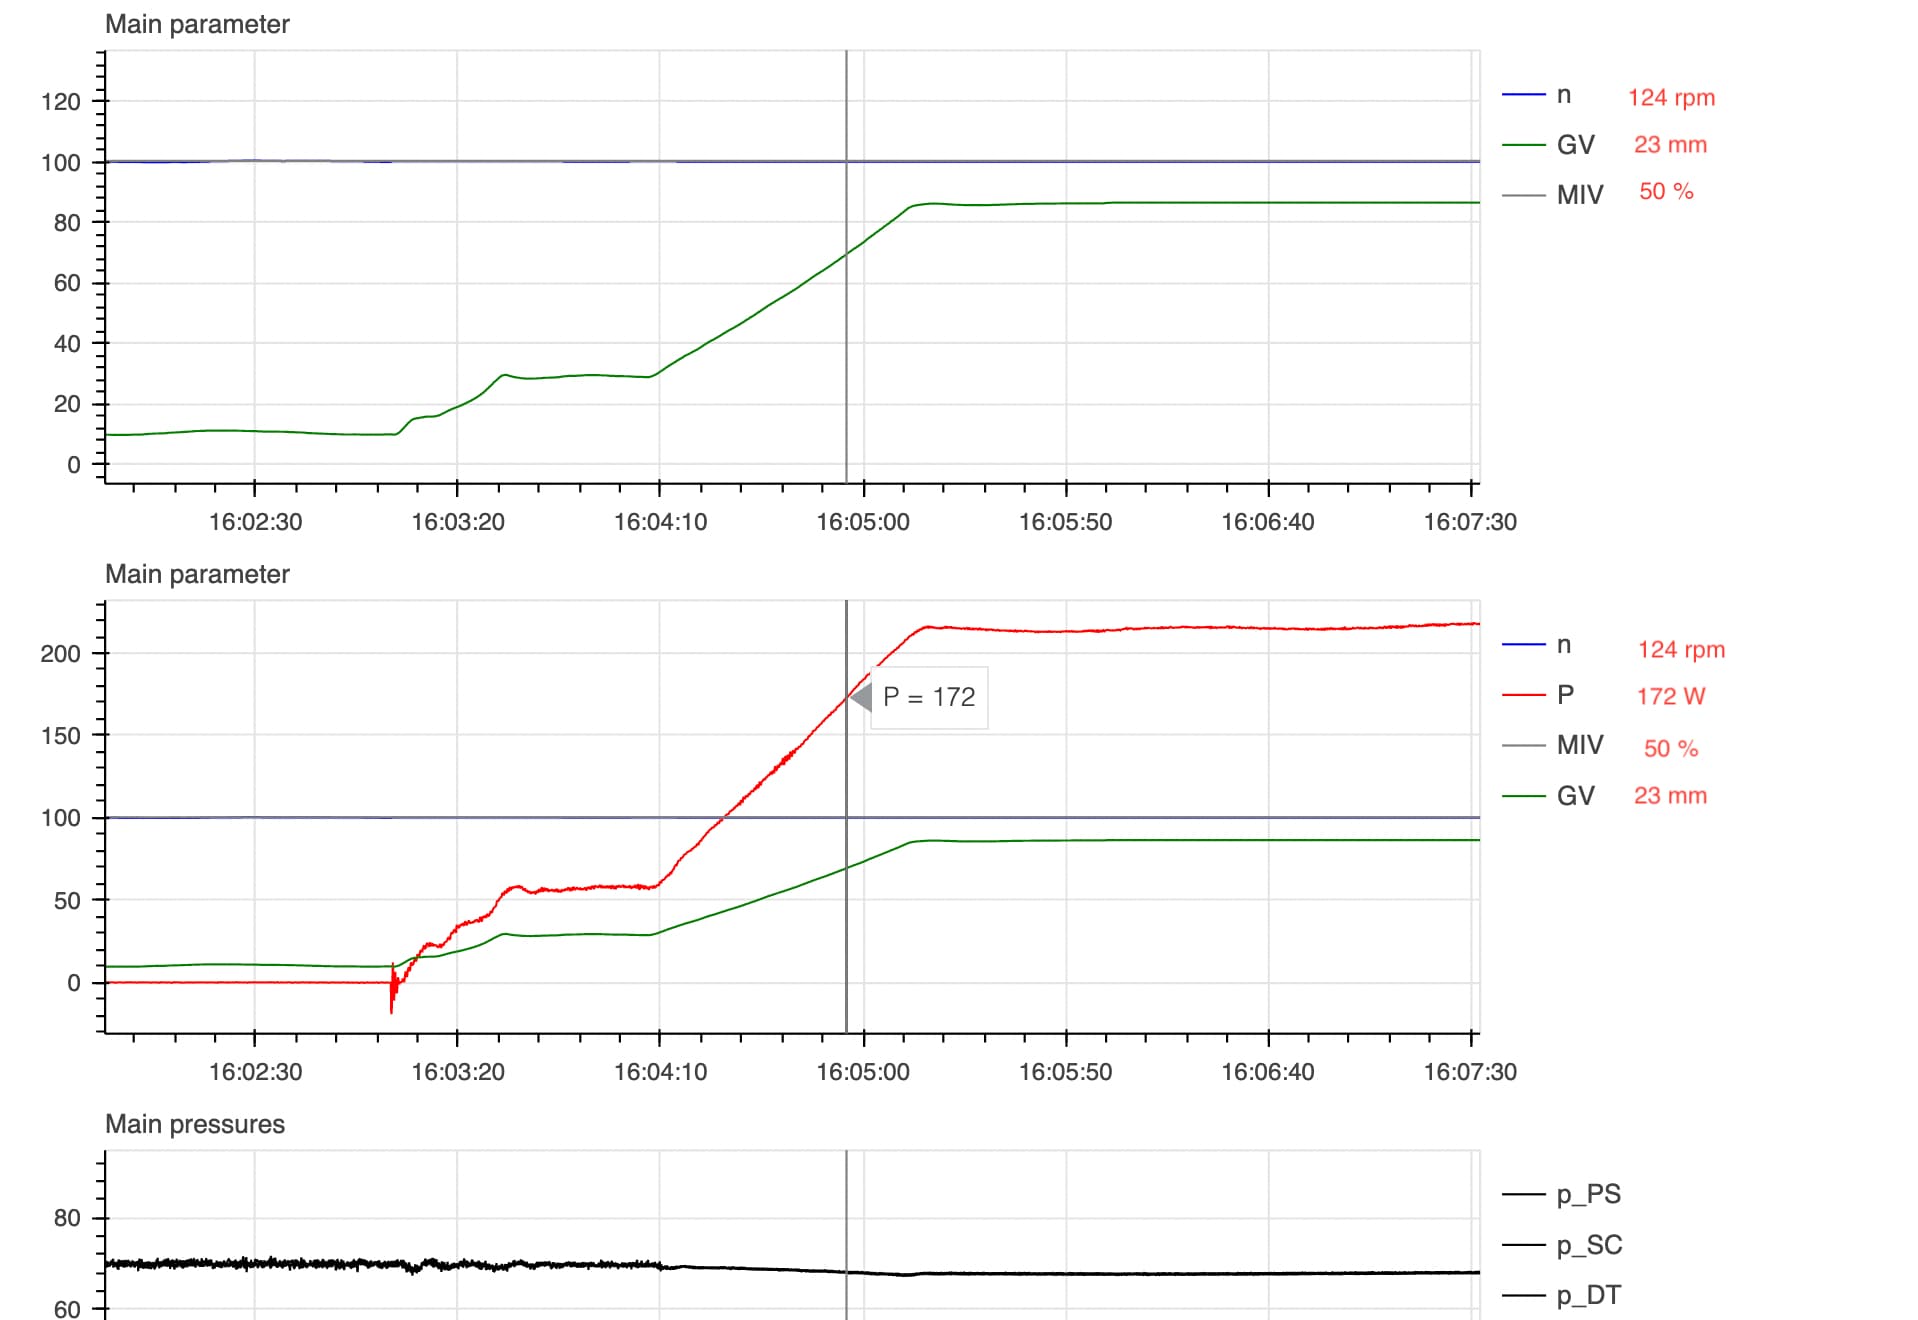
 ). They want a more “traditional” consistent legend denoting everything being shown in the plot area, with the added optional enhancement of the values of these items being updated on hover. A bit of cake and eating it too… but a big reason for this (and I understand where they’re coming from), is that while the hovertools can obviate a lot of need for annotations like legends, they don’t eliminate it when a) the user wants to take an image screengrab and dump it in powerpoint for a conference presentation or something, or b) they require a pdf regulatory submission and again need fully annotated static images/figures.