How do I get a "Range Select Tool"?

I would like to have a selection tool with which I can select a range (in this specific case the x-axis, but don’t think that matters), independently of the underlying data, and then be able to somehow get the coordinates of that range.

The Box Select Tool works somewhat, except that

  1. It doesn’t seem to work with lines
  2. It’s connected to the plotted data, i.e. if no plotted data in that range, nothing is selected
  3. It doesn’t create an overlay that is visible and is adaptable

Point 1 can be worked around by plotting an additional scatter with alpha=1, but that’s not ideal. Also the selection is not visible like this. Then I can get the selection via source.data_source.selected.indices (and getting the first and last one).

The Range Tool seems to have the correct UX, except that is seems to be made to adapt the range of another figure, which is not what I’m looking for. Unless I misunderstand its usage, it seems to be necessary to set at least either x_range or y_range as the range of another figure, which in my case is not applicable.

So is it possible to have the range selection behaviour of the Range Tool, but without it being connected to another plot, and to just get the coordinates of the selected range?

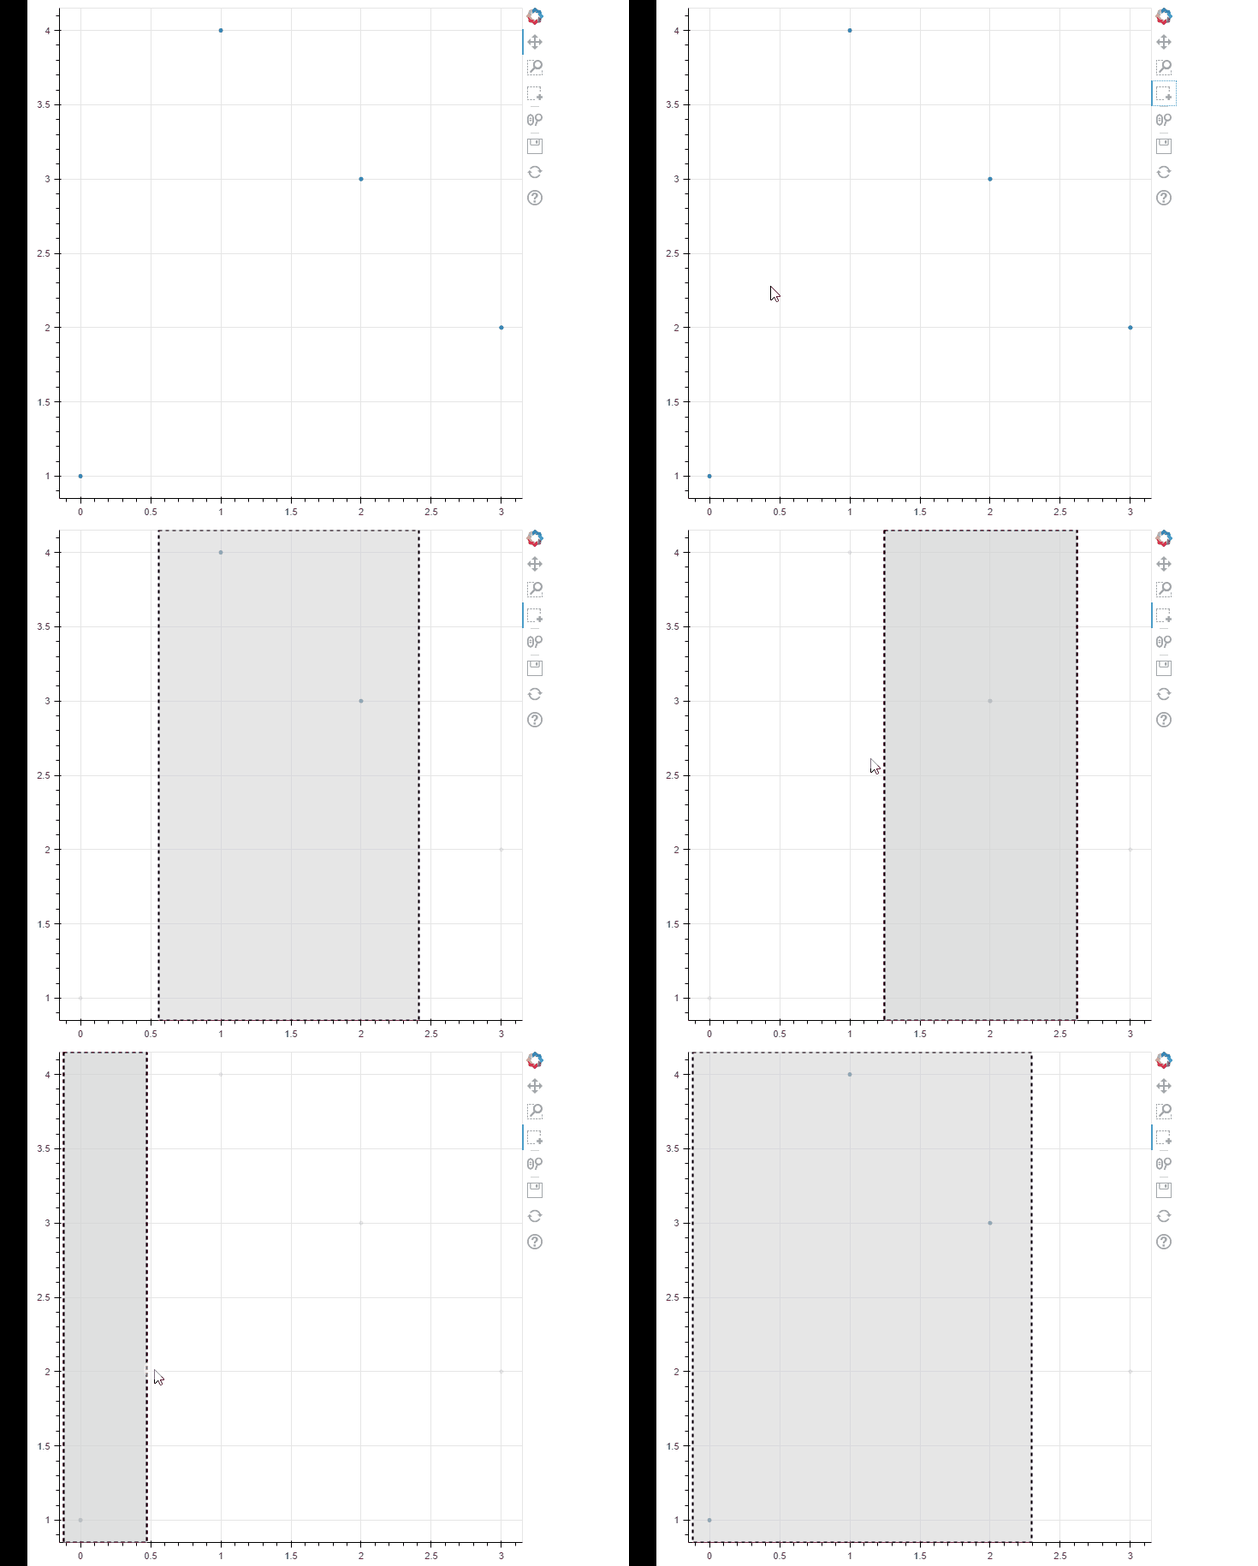
I immediately knew about BoxSelect having a dimensions arg that you could use to get like 80% of the way there. Then I started thinking about the simplest way to create the overlay you described in point 3 and came up with this:


"""
Created on Mon Aug 15 11:00:34 2022

@author: Gaelen
"""

from bokeh.plotting import figure, show, save
from bokeh.models import BoxSelectTool, ColumnDataSource,CustomJS

src = ColumnDataSource(data={'x':[0,1,2,3],'y':[1,4,3,2]})
f = figure()
r = f.scatter(x='x',y='y',source=src)

#width dimensions arg will allow box select to only vary things horizontally
bsel = BoxSelectTool(renderers=[r],dimensions='width')

#isolate the overlay annotation that the box select tool produces
bannot = bsel.overlay
bsel.select_every_mousemove=True #may want to not have this if you have a shit tonne of data but yeah
#make a clone/copy of that annotation to use as a "sticky" box, i.e. one that will stay and have the same theme/formatting
sticky_box = bannot._clone()

#set the left and right units to data (box select overlay default uses screen units, we need to change this for our sticky_box)
sticky_box.left_units='data'
sticky_box.right_units='data'

#callback for when user starts panning in the figure --> if the box select tool is active, initialize the left and right bounds for the sticky_box
cbstart = CustomJS(args=dict(bsel=bsel,sticky_box=sticky_box),code='''
                    if (bsel.active==true){
                            sticky_box.left = cb_obj.x
                            sticky_box.right = cb_obj.x
                            }
                    ''')
                    
#callback for when user continues their pan action in the figure --> if the box select tool is active, update the right to be where they've panned to
#this still seems to work fine when you pan left or right, but be wary that this means it's possible that .right can be less than .left if you want to link this to more complex callbacks later
cb = CustomJS(args=dict(bsel=bsel,sticky_box=sticky_box),code='''
              if (bsel.active == true){
                          sticky_box.right = cb_obj.x
                          }
              ''')
#tell these two callbacks to happen when the user starts panning and while they're panning respectively
f.js_on_event('panstart',cbstart)
f.js_on_event('pan', cb)

#add the sticky box and the box select to the f
f.add_tools(bsel)
f.add_layout(sticky_box)

show(f)

zoom_anno

Finally to your point 1, there is absolutely a great workaround for this → essentially you create a separate CDS to drive a “selected_line” glyph, and you assemble the data for it in the callback based on the selected scatter source indices. I made an example of this for someone a while back, let me try and find it…

Found it! How to highlight a selected area in the graph and finding max-min values with using Bokeh? - #2 by gmerritt123 .

With this and the above example you should have the tools to accomplish all 3 of your desirables. :slight_smile:

Yes. While you may configure a RangeTool with some existing plot’s range, you do not have to. Just create a new Range1d manually, and pass that to the RangeTool. You can attach any standard Python or JS callbacks to the range you created.

Hi gmerrit,

Thanks, if I can’t get it to work otherwise, this is a possible workaround. But ideally I would prefer not to have to plot some hidden lines.

Hi Bryan,

Thanks for the answer. I actually tried that before I posted the question and it didn’t work. But I do get it to work in a simple example, so I have to figure out what is going wrong in my larger code.

And is there a way to also remove the overlay completely from the GUI (and have it also not be there at the start), for example when clicking outside of the figure?

(Edit: changed this comment a lot because I found the real problem)

Ok, I think I found the problem. I did not set the start and end when creating the Range1d object, so it was just not within the view.

But that does again bring the other question into view. Would it be possible to remove the range/overlay, or have it “not set” by clicking somewhere? And would it be possible to create it again?

It wouldn’t make sense to just send it somewhere out of view to have it “not set”, because then I’d have to go get it there to have it in view again (additionally, I’d prefer the range, which I like to retrieve, to not give me some random value when “not set”).

Can you share your working code here dumbed down to a MRE kinda like my alternative option? I’d like to explore this too and maybe can get a better understanding of what you’re asking for with example code.

1 Like

A click or tap callback could set the visibility (alpha) of the tool’s overlay to zero.

because then I’d have to go get it there to have it in view again

I don’t see why, you can set the configured range programmatically, and the tool’s overlay should update accordingly.

@Bryan
I want to make the overlay reappear when I click on the figure (with the RangeTool on), without having to do it programmatically. I guess this can also be achieved with a click callback?

Then there is still the problem that when I retrieve the start and end values from the range programmatically, I want to have some obvious, unambigous values that let me know when that range was unset or not set. So just setting the alpha to zero or moving it out of view is not good enough.

NaN values are not accepted it seems. But I realized I can set the end value of the x_range of the Range1d smaller than the start value (e.g. start=0, end=-1). Is there any possibility that this would happen (i.e., x_range.end < x_range.start) if the range is set by the user with the mouse? If not, this could be a good way to signify “unset”.

@gmerritt123
Thanks for being interested to help. It seems that what I want to achieve may be possible, but my JS is not good enough (yet?). It’s difficult to give my code, as it involves a lot of other stuff. But what I want to get is basically the RangeTool, which is not in view/set from the start. When the RangeTool is turned on and I click on the figure, it should create a range. When I click outside of the figure again, the range should disappear/be unset again.

I also want that when I retrieve the values of the range programmatically, there are are some unambiguous values to tell me that the range is “unset”. start=0, end=-1 may be a good possibility (see above).

I guess an MRE would perhaps be:

import numpy as np
from bokeh.plotting import figure, show
from bokeh.models import RangeTool
from bokeh.models.ranges import Range1d

x = np.arange(0,20,0.001)
t = np.datetime64('2022-08-16T12:00:00','ms') + np.timedelta64(1000,'ms')*x

p = figure(x_axis_type='datetime')
p.line(t,np.sin(x))
p.add_tools(RangeTool(x_range=Range1d(start=0, end=-1)))
show(p)

Note that I set the start and end values to 0 and -1, which means that the range will be out of view, as well as when I do p.tools[-1].x_range.start and p.tools[-1].x_range.start I get 0 and -1 as output (of course only works when using a server and not with show). This lets me know the range is “unset”.

What I still miss is:

  • The range should be invisible at start.
  • When I click on the figure (or try to make a range) with the RangeTool on, the range should become visible and be set accordingly.
  • And when I click again outside of the figure, the range start and end should be set again to 0 and -1, and the overlay invisible again.
You could also check the alpha value any time you need to get the coordinates? An alpha of zero is an unambiguous sign that the range is currently “not set”.

Yes, that is also a good possibility. Thanks.

1 Like

This topic was automatically closed 90 days after the last reply. New replies are no longer allowed.