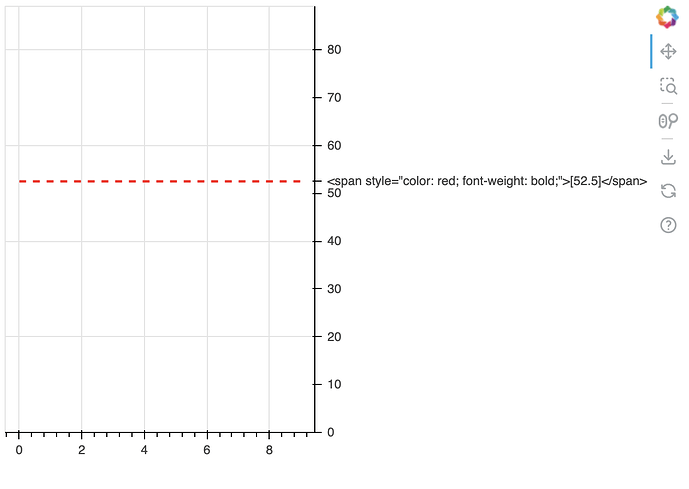
I like to show the hline y value on right y axis tick label area.
I could draw the hline y value on that area with CustomJSTickFormatter, but when I tried to change the color or font size of the value using HTML, I failed it.
Is there any way to draw the value on that area?
from bokeh.plotting import figure, show
from bokeh.models import ColumnDataSource, Range1d, LinearAxis, FixedTicker
from bokeh.models.formatters import CustomJSTickFormatter

p = figure(width=600, height=400)

p.yaxis.visible = False
right_axis = LinearAxis()
p.add_layout(right_axis, 'right')

x = list(range(10))
y = [i**2 for i in x]

hline_value = 52.5
hline = p.line(x=[min(x), max(x)], y=[hline_value, hline_value],
               line_color='red', line_dash='dashed', line_width=2)

y_range_max = max(max(y), hline_value) * 1.1
p.y_range = Range1d(0, y_range_max)

def generate_ticks(max_val, hline_val, step=10):
    ticks = list(range(0, int(max_val) + step, step))
    ticks.append(hline_val)
    return sorted(set(ticks))

new_ticks = generate_ticks(y_range_max, hline_value)

right_axis.ticker = FixedTicker(ticks=new_ticks)

right_axis.formatter = CustomJSTickFormatter(code="""
    var tick_val = parseFloat(tick);
    var hline_val = %f;
    if (Math.abs(tick_val - hline_val) < 1e-10) {
        var label = Number.isInteger(hline_val) ? hline_val.toFixed(0) : hline_val.toFixed(1);
        return `<span style="color: red; font-weight: bold;">[${label}]</span>`;
    }
    return tick_val.toFixed(0);
""" % hline_value)

show(p)
