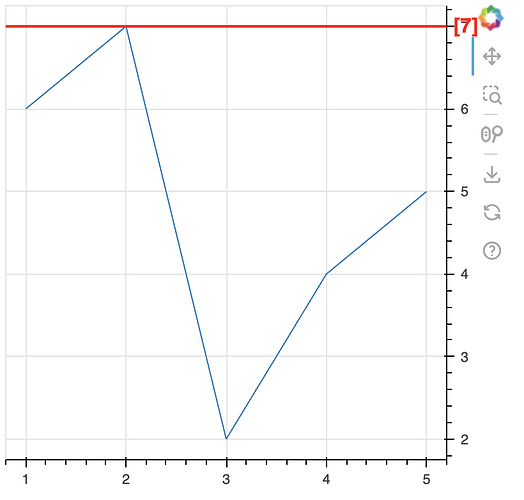
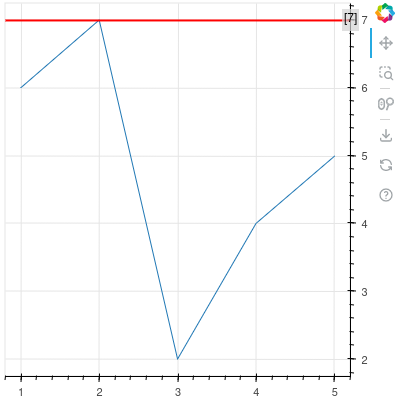
I am trying to lay the Label on y axis tick label area for solving the problem below.
https://discourse.bokeh.org/t/html-rendering-in-customjstickformatter/11988
When I tried to lay the Label on that area, the Label was underlaid and did’t show. I added the level=‘overlay’ on the Label but no effect.
I happened to discover when I used add_layout(label, ‘below’), it showed.
I am wondering why it shows by that way. ‘below’, ‘above’, ‘left’ have the effect on showing, but ‘center’, ‘right’ are of no effect.
But when I used LabelSet instead of Label, the add_layout trick didn’t work.
Moreover when I applied add_layout(label, ‘below’) on my real chart module, that broke the layout of my chart.
What is the right way to lay the label on axis tick label area?
from bokeh.plotting import figure, show
from bokeh.models import Label, Span

x = [1, 2, 3, 4, 5]
y = [6, 7, 2, 4, 5]

p = figure(width=400, height=400, y_axis_location="right")

p.line(x, y)

hline_value = 7
hline = Span(location=hline_value, dimension='width', line_color='red', line_width=2)
p.add_layout(hline)

label = Label(x=400-40, y=hline_value, text="[%d]" % hline_value, y_units="data", x_units="screen",
                level='overlay',
                text_align="center", text_baseline="middle",
                text_font_size="12pt", text_color="red", text_font_style="bold")
p.add_layout(label, 'below')

show(p)

