Is there a possibility to have html in the axis major labels?
Bryan
July 24, 2021, 10:15pm
2
@Nabster No, not currently. The entire plot, including tick labels, is rendered on an HTML raster canvas, which does not support HTML formatting. Making this possible would require rendering individual tick labels as independent, absolutely positioned DOM elements on top of the canvas. It’s not impossible, but woudl be non-trivial, and it also might not be workable at all with some export methods. You could open a GitHub development discussion to propose it as a feature and see if there is any more interest or support for the idea.
You can check this previous post.
Hello !!!
Before nothing, thanks for this amazing library !!
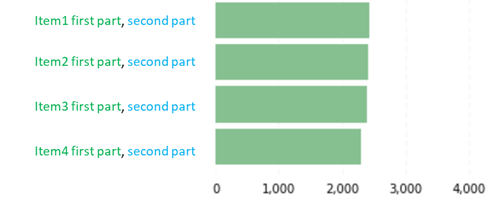
I need to make a categorial axis with some ticks bold and some ticks not.
I use the example from the docs.
from bokeh.io import output_file, show
from bokeh.models import ColumnDataSource, FactorRange
from bokeh.plotting import figure
from bokeh.transform import factor_cmap
from bokeh.palettes import Spectral6
output_file("wells.html")
wells = ['gbk1155','gbk1157','gbk0924','gbk0730','gbk0724',
'gbk1051','gbk1050','gbk1…
With a custom extension you can control each tick label independently when it is rendered, it is really hacky and not robust, but it works.
In that moment I had generated a github issue you can check here
opened 09:22PM - 28 Sep 20 UTC
type: discussion
tag: API: models
**Is your feature request related to a problem? Please describe.**
It is not re… lated to a problem
**Describe the solution you'd like**
I would like to be able to customize independently the font label ticks as described here
https://discourse.bokeh.org/t/change-independently-categorical-ticks/6434/2
I think a new separate “tick font formatter” where you can make some important items bold or a different color should be nice.
**Describe alternatives you've considered**
In the meantime I am trying to implement a custom extension Axis subclasss to override the font style.
**Additional context**
I would like to have a figure like this
<img width="720" alt="inyectivities_bold_light" src="https://user-images.githubusercontent.com/46707985/94487377-4862a780-01b7-11eb-8bb1-309371619863.png">
You can see the label ticks nearest to the xaxis some are bold and some not.
Thanks a lot, this is quite a workaround…
I am not an expert programmer, but it can be done leaner subclassing the categoricalAxis class, though I was not able to do it.
@nghenzi ,
system
October 24, 2021, 12:18pm
7
This topic was automatically closed 90 days after the last reply. New replies are no longer allowed.