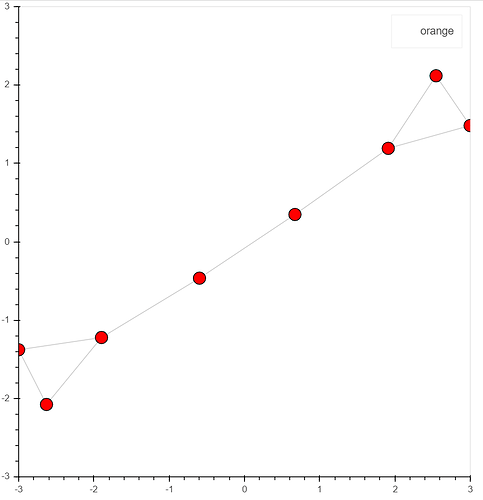
Hi, I’m wondering how I can assign an interactive legend to the network to to mute specific communities in the network - is this possible?
My current function:
## Visualization function

def visualize_network(GraphObject, meta_df, day, save_map=False):

    #Create a network graph object with spring layout
# https://networkx.github.io/documentation/networkx-1.9/reference/generated/networkx.drawing.layout.spring_layout.html
    network_graph = from_networkx(GraphObject,
                                  nx.spring_layout,
                                  scale=10, center=(0, 0))
    ## create the colors, add meta label:
    cpalette = [item for sublist in Category20.values() for item in sublist]

    for i,r in meta_df.iterrows():
        if i == 0:
            network_graph.node_renderer.data_source.data.setdefault('COLORS', []).append((cpalette[r.Community]))
            network_graph.node_renderer.data_source.data.setdefault('title', []).append(r.title)
            network_graph.node_renderer.data_source.data.setdefault('Entities', []).append((r.doc_))
            network_graph.node_renderer.data_source.data.setdefault('Community', []).append((r.Community))
            network_graph.node_renderer.data_source.data.setdefault('Source', []).append((r.source))
            network_graph.node_renderer.data_source.data.setdefault('Date', []).append((r.publication_date.strftime('%d/%m/%Y')))

        else:
            network_graph.node_renderer.data_source.data['COLORS'].append((cpalette[int(r.Community)]))
            network_graph.node_renderer.data_source.data['title'].append(r.title)
            network_graph.node_renderer.data_source.data['Entities'].append((r.doc_))
            network_graph.node_renderer.data_source.data['Community'].append((r.Community))
            network_graph.node_renderer.data_source.data['Source'].append((r.source))
            network_graph.node_renderer.data_source.data['Date'].append((r.publication_date.strftime('%d/%m/%Y')))

    #Establish which categories will appear when hovering over each node
    HOVER_TOOLTIPS = [("Community","@Community"),("Title", "@title"), ("entities","@Entities"),
                      ('Source','@Source'),('Date','@Date')]
    #Create a plot — set dimensions, toolbar, and title
    plot = figure(tooltips = HOVER_TOOLTIPS,
              tools="pan,wheel_zoom,save,reset", active_scroll='wheel_zoom',
            x_range=Range1d(-10.1, 10.1), y_range=Range1d(-10.1, 10.1),
                  title=f"Coverage of {EVENT} - Day {day}",
                 width=1000, height=800)

        #Set node size and color
    network_graph.node_renderer.glyph = Circle(size=15, fill_color='COLORS')

    #Set edge opacity and width
    network_graph.edge_renderer.glyph = MultiLine(line_alpha=0.5, line_width=1)

    #Add network graph to the plot
    plot.renderers.append(network_graph)

    if save_map is True:
        save(plot, filename=f"{EVENT}_Day{day}.html")
    else:
        show_map(plot)

    return


