So following up with this post : (Legend in network graph), I ran into issues with including a legend when plotting a network graph. The code in that post serves as a minimal reproducible example:
import networkx as nx

from bokeh.io import  show
from bokeh.models import Legend, LegendItem
from bokeh.plotting import figure, from_networkx

G=nx.nx.barbell_graph(3,2)

p = figure(x_range=(-3,3), y_range=(-3,3))
p.grid.grid_line_color = None

r = from_networkx(G, nx.spring_layout, scale=3, center=(0,0))
r.node_renderer.glyph.size=15
r.edge_renderer.glyph.line_alpha=0.2
r.node_renderer.glyph.fill_color="red"


p.renderers.append(r)
legend = Legend(items=[
    LegendItem(label="orange", renderers=[r.node_renderer])])
p.add_layout(legend)
show(p)
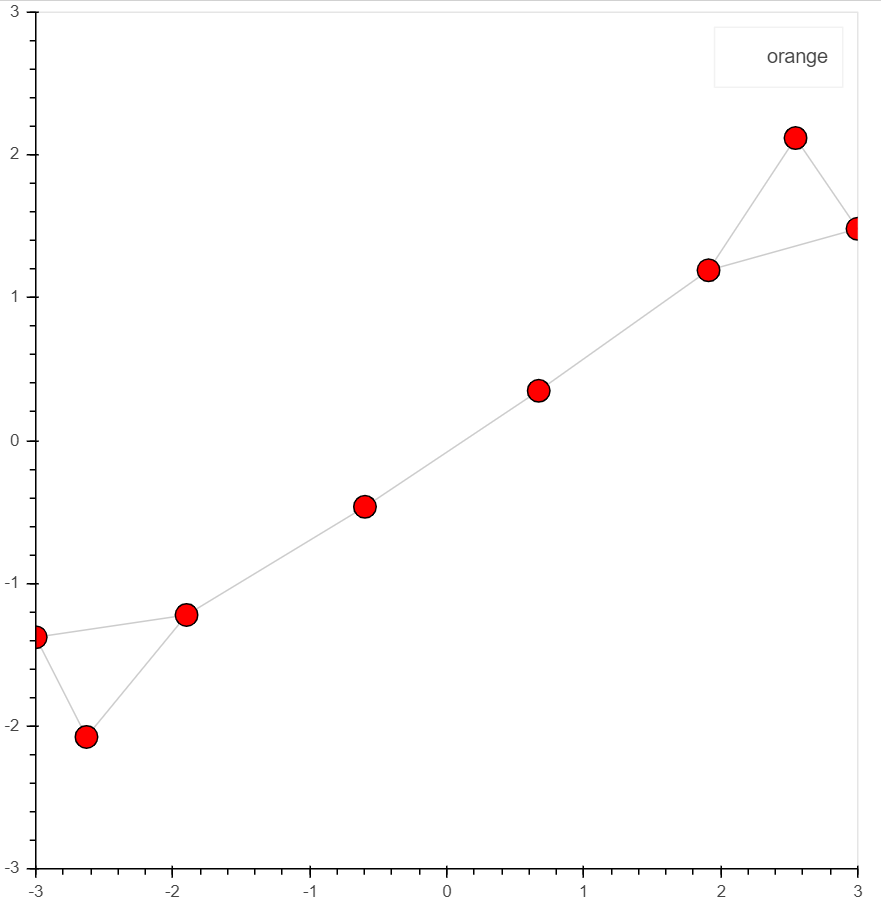
Though indicated by @Bryan that it was working as expected, it no longer does so at this point in time for me (windows 10, chrome + firefox). For one the legend doesn’t include the colored glyph:
Second, when I drag (as you would with box select) any area on the graph, things go crazy and I get a kind of recursive zoom as shown in this pic:
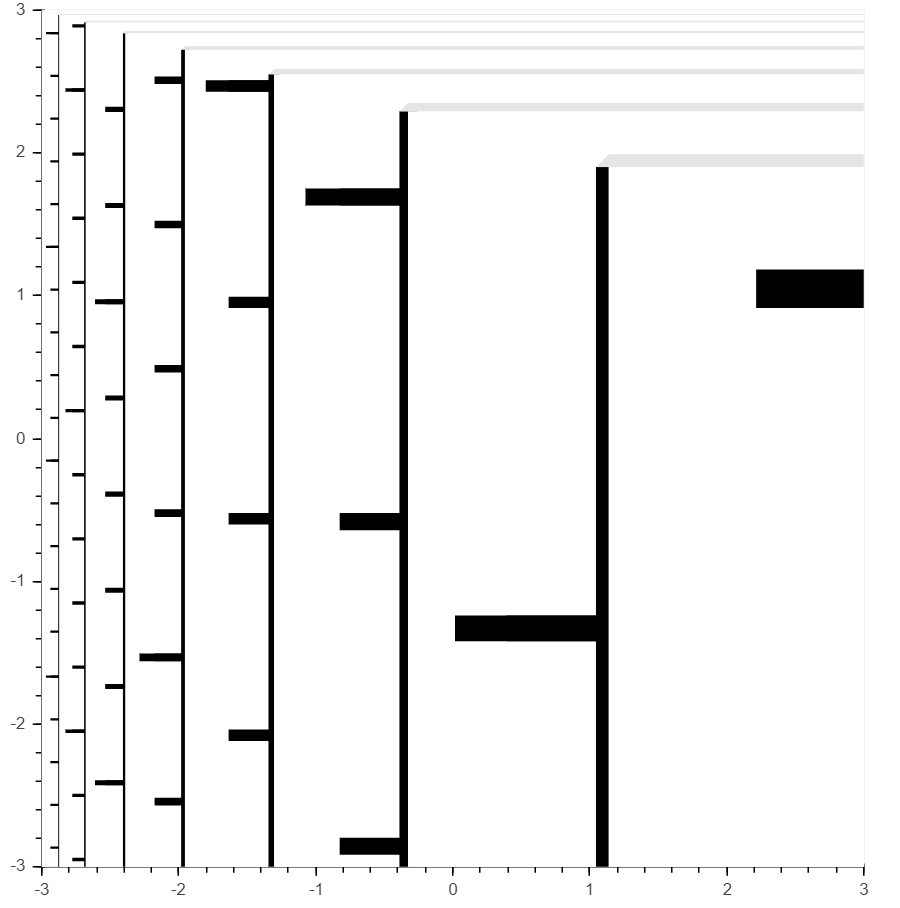
The behaviour on firefox is different but still buggy.