Hi everyone! I am trying to create a scatterplot graph in which the points have different shapes due to one characteristic and different colors due to a different characteristic in my categorical dataset. The issue here is that I need two legends to display this: one with circles of different colors to display the color-coded characteristic, and another with different shapes to display the shape-coded characteristic. However, really having trouble both with isolating just one characteristic per legend as well as having two legends at once in the graph.
SHAPES = [‘Square’, ‘Rectangle’, ‘Rhombus’, ‘Circle’, ‘Triangle’]
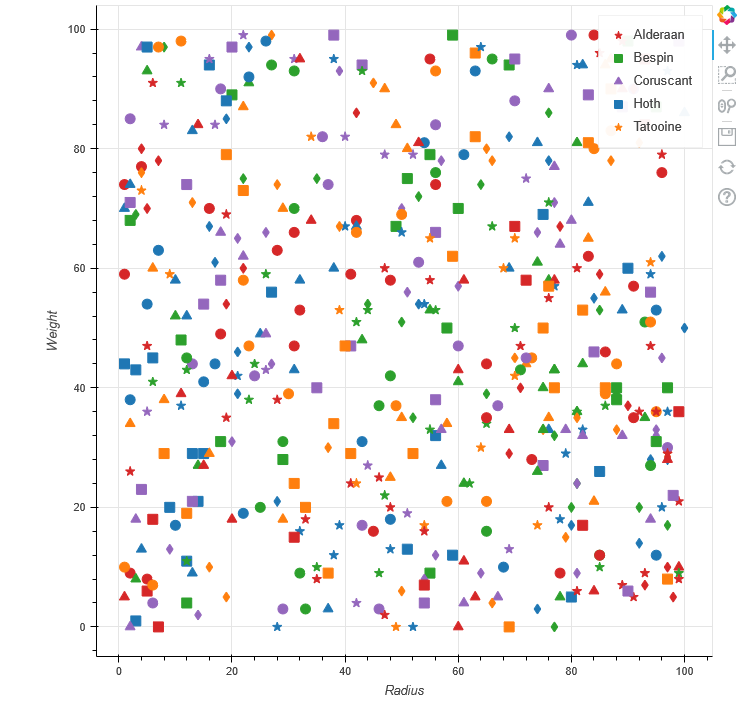
PLANETS = [‘Hoth’, ‘Tatooine’, ‘Bespin’,‘Alderaan’, ‘Coruscant’]
MARKERS = [‘square’, ‘star’, ‘circle’, ‘triangle’, ‘diamond’]
fig.scatter(“Radius”, “Weight”, source=df, size=10, marker=factor_mark(‘Shape’, MARKERS, SHAPES),
color=factor_cmap(‘Planet of Origin’,‘Category10_5’, PLANETS))