Hi, I am using bokeh to make a standalone HTML file to plot some dataframe data with a datetime index and some other columns. The problem is I want to resample(just like pandas.resample) the ColumnDataSource of the plot in CustomJS through a slider, so people can change the resample freq at any time in a browser, But I don’t know how to resample it in CustomJS, does it possible?
I see two options, and the optimal one to go with will depend on a) the size/complexity of your data, b) how complex you want the resampling options for the user to be, and c) your JS skills/willingness to ride the struggle bus learning more JS
-
If your data is relatively small and you want the user to only be able to resample a few different ways (for example, raw, weekly, monthly, and yearly with the same aggregation applied for each of them), then you could “pre-resample” the data and store the results of each in a big dictionary, and have the columndatasource used to drive the renderers change to a different dictionary key when the user selects a different resample option (aka .js_on_change(‘value’,…) on the slider). Obvious benefit to this is it limits the JS to only a few lines and there would be no heavy calcs to do on the fly, while the drawback is it’s not very “data size economical” as you’re essentially embedding the resampling results in the html as opposed to calculating them “on the fly”, so you’ll run into data size and the number of user-defined resample options pretty fast… but it might be all you need. I’ve implemented this approach many times with contour data → i’ve use matplotlib.tricontour to generate line geometries of contours, which i then send to a dictionary whose keys are a time index, when the user moves the slider to move to different times, it doesn’t do the contouring on the fly, it just renders the “pre-calculated” contours for that particular time.
-
You implement some more complex JS to do the resampling on the raw data “on the fly”, likely using some external resources to help you along the way. D3.js is probably what I’d try use, it has binning and interpolation functions that could probably be melded into what pandas’ .resample does. Advantage to this is that only the raw data would get embedded in the html → the js would do the resampling work on the fly so it’d be far more data-efficient so the sky could be the limit when it comes to the number of resampling options you provide the user with (e.g. fine time resolution on the slider + different aggregation options), while the drawbacks would be potentially slow/laggy as essentially the resampling work would be done each time the user moves the slider, and of course you’d have to suffer through learning more JS etc, which can be a fun ride (if suffering is what you’re into
 )
)
Thank you very much for your experience! Thanks for so many words! I find that it may be complicated and uneconomic to deal with data by CustomJS. So I have turned to bokeh server and use pandas .
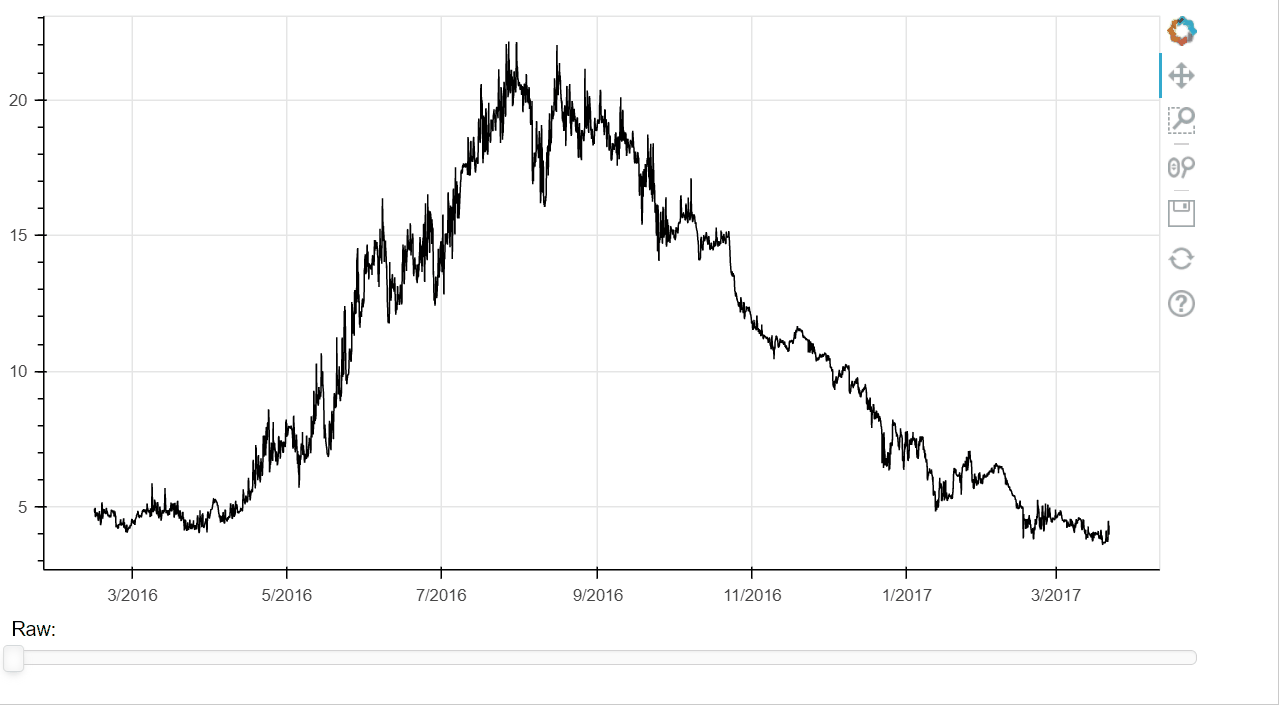
Alright, because this was of interest to me and because I’m likely gonna have to flesh this kind of thing out for my job sooner or later, here’s a working example of upsampling on the fly. It assumes the data you’re passing in has consistent time steps (so an initial pandas resample would be required on the data before passing it in here), and it only upsamples (by binning and taking the mean). But it’s a start I think.
Also see this thread where I asked about the little function I hacked together to save bokeh with additional JS resources: Importing additional JS resources to standalone html document - I use this function here as you’ll see…
I added as much commenting as possible but strongly suggest console.logging the crap out the callback to see what’s going on.
# -*- coding: utf-8 -*-
"""
Created on Sat Nov 20 19:11:45 2021
@author: gmerritt
"""
import numpy as np
import pandas as pd
from bokeh.models import Line, ColumnDataSource, CustomJS, Slider
from bokeh.plotting import figure
from bokeh.layouts import layout
from bokeh.sampledata import sea_surface_temperature

from bokeh.embed import components
from bokeh.resources import Resources

def save_html_wJSResources(bk_obj,fname,resources_list,html_title='Bokeh Plot'):
    '''function to save a bokeh figure/layout/widget but with additional JS resources imported at the top of the html
    resources_list is a list input of where to import additional JS libs so they can be utilized into CustomJS etc in bokeh work
    e.g. ['http://d3js.org/d3.v6.js']
    '''
    script, div = components(bk_obj)
    resources = Resources()
    # print(resources)

    tpl = '''<!DOCTYPE html>
    <html lang="en">
        <head>
            <meta charset="utf-8">
            <title>'''+html_title+'''</title>
            '''
    tpl = tpl+resources.render_js()
    for r in resources_list:
        tpl = tpl +'''\n<script src="'''+r+'''"></script>'''

    tpl = tpl+script+\
        '''
            </head>
            <body>'''\
                +div+\
            '''</body>
        </html>'''

    with open(fname,'w') as f:
        f.write(tpl)


df = sea_surface_temperature.sea_surface_temperature

data = {'time':np.array(df.index),'temperature':np.array(df['temperature'])}

src = ColumnDataSource(data=data)
glyph = Line(x='time',y='temperature')

f = figure(height=400,width=800,x_axis_type='datetime')
rend = f.add_glyph(src,glyph)

#slider_dict, each value on the slider corresponds to a specific time bin size
slider_dict = {0:'Raw',1:'12 Hours',2:'Daily',3:'Weekly',4:'Biweekly'}
sl = Slider(value=0, start=0, end = 4, step =1, show_value = False, title = 'Raw')

#conversion dictionary to pass to callback -> i.e. specific bin sizes
conv_dict = {'12 Hours':pd.to_timedelta('12H').total_seconds()*10**3
             , 'Daily':pd.to_timedelta('1D').total_seconds()*10**3
             ,'Weekly':pd.to_timedelta('7D').total_seconds()*10**3
             ,'Biweekly':pd.to_timedelta('14D').total_seconds()*10**3}

#WHAT are we passing to the callback?
#the datasource driving the renderer, the raw data rearranged for d3.js to do its thing (see TRICK below)
#, the conversion dict (to get bin size)
#, and the slider + the slider_dict (to retrieve the current value of the slider/the bin size selected by user)
#TRICK: convert your df to an array of objects (which d3.js loves to work on) by using the .to_dict('records') method
cb = CustomJS(args = dict(src=src, obj=df.reset_index().to_dict('records')
                          ,conv_dict=conv_dict,sl=sl,slider_dict=slider_dict)
              ,code='''
              //only transform the raw data if value isn't 0
              if (sl.value>0){
                 //get the bin size from the slider value
                  const binsize = conv_dict[slider_dict[sl.value]]
                  //use d3.extent and d3.range to define your bins (they call them thresholds)
                  const [min, max] = d3.extent(obj, d=>d.time);
                  const thresholds = d3.range(min, max, binsize);
                  //create a binning function that will act on the .time property on obj
                  const binner = d3.bin().thresholds(thresholds).value(x=>x.time)
                  //apply that binner to the obj
                  const binned = binner(obj)
                  //do the aggregation using d3.rollup on each bin
                  //the aggregation function will calc the average temperature using d3.mean, and the midpoint of the bin
                  const ru = binned.map(x=>d3.rollup(x, function(v) {return {'time': (v.x1-v.x0)/2+v.x0,
                                                                             'temperature': d3.mean(v,d=>d.temperature)}}))
                  //this is a cool trick that will convert the array of objects (that d3.js likes) into an object of arrays (that bokeh's CDS likes)
                  var upd_data = d3.rollup(ru, function(v) {return {'time':Array.from(v,d=>d.time)
                                                               ,'temperature':Array.from(v,d=>d.temperature)}})
                                                        }
              //basically just do that same trick but on the raw data if the slider value is 0
              else {var upd_data = d3.rollup(obj, function(v) {return {'time':Array.from(v,d=>d.time)
                                                           ,'temperature':Array.from(v,d=>d.temperature)}})
                    }
              //update the slider title and the src.data
              sl.title = slider_dict[sl.value]
              src.data = upd_data
              src.change.emit()

              ''')

sl.js_on_change('value',cb)
lo = layout([f,sl])
#call my hacked out "special save" function to gain access to the d3.js resources
save_html_wJSResources(lo,'Test.html',['http://d3js.org/d3.v6.js'],'On the Fly Smoothing')
Check it out:
Thank you very very very much! That looks like perfect! I like it. I’ll try in my browser console and study what is going on. 