Scatter plot legend doesn't update correctly when data is updated

Hello,

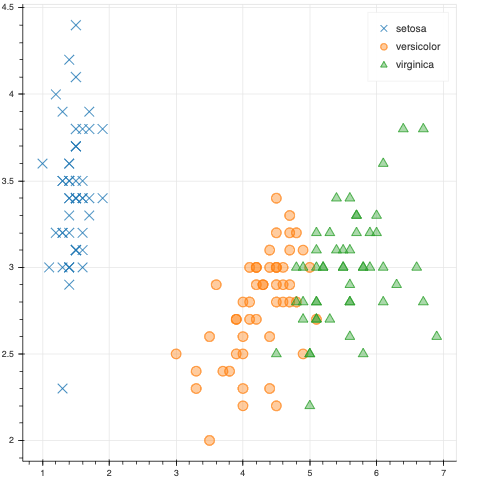
I’m using scatter to make an interactive plot. Since hiding individual glyphs doesn’t seem to work with this type of plot, I’ve implemented some checkboxes to include/remove certain subsets of the data. I’m using legend_group to create the legend.

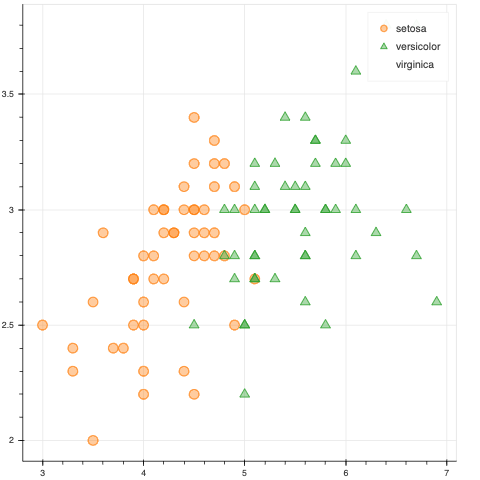
The problem is, when I subset the data, the legend labels stay put, but the glyph of the removed group is removed and the remaining labels get shifted. Is this the expected behavior?

I have modified the code from this example to show what is happening.

If there is a better way to get this done, please let me know!

Thank you!

from bokeh.models import Legend, LegendItem, ColumnDataSource
from bokeh.palettes import Category10_3
from bokeh.plotting import figure, show
from bokeh.sampledata.iris import flowers
from bokeh.transform import factor_cmap, factor_mark
from bokeh.io import curdoc
from bokeh.models.widgets import CheckboxGroup
from bokeh.layouts import column

flowers_ss = flowers.copy()
flower_source = ColumnDataSource(flowers)
              
def update_data(attr,old,new):
    s_match = '|'.join([SPECIES[x] for x in new])
    flowers_ss = flowers[flowers['species'].str.contains(s_match)]
    flower_source.data = dict(
            sepal_length=flowers_ss['sepal_length'],
            sepal_width=flowers_ss['sepal_width'],
            petal_length=flowers_ss['petal_length'],
            petal_width=flowers_ss['petal_width'],
            species=flowers_ss['species'])

SPECIES = ['setosa', 'versicolor', 'virginica']
MARKERS = ['x', 'circle', 'triangle']

p = figure()
        
# plot the actual data using factor and color mappers (using the same
# column `species` here but you can use two different columns if you want)
r = p.scatter("petal_length", "sepal_width",
              source=flower_source, fill_alpha=0.4, size=12,
              legend_group='species',
              marker=factor_mark('species', MARKERS, SPECIES),
              color=factor_cmap('species', Category10_3, SPECIES))

species_select = CheckboxGroup(
        labels=SPECIES,
        active=list(range(len(SPECIES))))

species_select.on_change('active', update_data)

curdoc().add_root(column(p, species_select))

bokeh_plot
bokeh_plot (1)

A legend is a static thing in Bokeh. It’s not updated when something else changes, but you can update it yourself.

Regarding data shifting - the behavior that you see is due to the default ranges being instances of DataRange1d. Unless you interact with the plot of set start/end manually, the ranges will continue adapting to the data.

With that being said, is there anything that prevents you from just calling scatter 3 times, one time for each species? This way, you would be able to use p.select_one(Legend).click_policy = 'hide' and remove the checkbox group altogether. It would also prevent the ranges from shifting because by default they take even the hidden glyphs into account, unless you set the only_visible flag.

If that’s not an option, you will have to manage the legend yourself. One additional change I would make is to avoid changing the data and just use a view with filters and change the filters:

from bokeh.io import show
from bokeh.layouts import column
from bokeh.models import ColumnDataSource, CDSView, BooleanFilter, CustomJS, Legend
from bokeh.models.widgets import CheckboxGroup
from bokeh.palettes import Category10_3
from bokeh.plotting import figure
from bokeh.sampledata.iris import flowers
from bokeh.transform import factor_cmap, factor_mark

flower_source = ColumnDataSource(flowers)

SPECIES = ['setosa', 'versicolor', 'virginica']
MARKERS = ['x', 'circle', 'triangle']

p = figure()
f = BooleanFilter(booleans=[True for _ in range(flowers.shape[0])])
r = p.scatter("petal_length", "sepal_width",
              source=flower_source, fill_alpha=0.4, size=12,
              legend_group='species',
              marker=factor_mark('species', MARKERS, SPECIES),
              color=factor_cmap('species', Category10_3, SPECIES),
              view=CDSView(source=flower_source, filters=[f]))

species_select = CheckboxGroup(labels=SPECIES,
                               active=list(range(len(SPECIES))))

species_select.js_on_change('active', CustomJS(args=dict(f=f, ds=flower_source),
                                               code="""\
    const active = new Set(cb_obj.active.map(i => cb_obj.labels[i]));
    f.booleans = ds.data.species.map(s => active.has(s));
    // Trigger an update.
    ds.change.emit();
"""))

show(column(p, species_select))

Note how it doesn’t require bokeh serve, so I used show there.

1 Like

That is great information, thank you.

I will probably go with calling scatter once for each species. This had occurred to me, but I thought there might be a way to do it just using one scatter call.

One thing I was not sure about with this approach, though, was how to split up the data. Naively, I would just create separate subsets for each species and use those as sources. Is there a better way?

My second question is regarding the filtering. I’ve been trying to avoid using javascript and do everything through the python interface. Is it possible to achieve the filtering you demonstrated with python?

Thanks again!

IMO splitting up and filtering the data is best done in JS - both because of flexibility and because it helps you avoid passing extra data around.

Regarding creating subsets - well, that’s exactly what CDSView is for. You can create GroupFilters to split the data in advance - since it doesn’t require any interactivity, there won’t be any need for JS.

Oh, I didn’t even know about CDSView!

Thanks!

I tried implementing this idea. The new issue is that I want the points to keep their color when they are selected, but I cannot figure out how to do this. This used to happen automatically when I used scatter.

I’ve tried by making an explicit ‘color’ column as well as using a factor_cmap. Here I show it with an explicit ‘color’ column. To see it not work with a factor_cmap, just replace 'color' with fcmap.

from bokeh.models import Legend, LegendItem, ColumnDataSource, CDSView, GroupFiilter
from bokeh.palettes import Category10_3
from bokeh.plotting import figure, show
from bokeh.sampledata.iris import flowers
from bokeh.transform import factor_cmap, factor_mark
from bokeh.io import curdoc
from bokeh.models.widgets import CheckboxGroup
from bokeh.layouts import column

def assign_color(x):
    if 'setosa' in x.species:
        return Category10_3[0]
    elif 'versicolor' in x.species:
        return Category10_3[1]
    elif 'virginica' in x.species:
        return Category10_3[2]

flowers['color'] = flowers.apply(assign_color, axis=1)
flower_source = ColumnDataSource(flowers)

SPECIES = ['setosa', 'versicolor', 'virginica']
MARKERS = ['x', 'circle', 'triangle']

p = figure(
        tools="pan,wheel_zoom,reset,box_select,lasso_select,save,tap",
        active_scroll='wheel_zoom')

fcmap = factor_cmap('species', Category10_3, SPECIES)

for sp, mark in zip(SPECIES, MARKERS):
    view = CDSView(source=flower_source,
            filters=[GroupFilter(column_name='species', group=sp)])
    r = getattr(p, mark)(
            "petal_length",
            "sepal_width",
            color='color',
            nonselection_fill_color='color',
            nonselection_line_color='color',
            nonselection_fill_alpha=0.5,
            nonselection_line_alpha=0.5,
            source=flower_source, fill_alpha=1, size=12,
            view=view,
            legend_label=sp)

p.legend.click_policy = 'hide'

p.x_range.renderers = [r] 
p.y_range.renderers = [r] 

# create an invisible renderer to drive shape legend
rs = p.scatter(x=0, y=0, color="grey", marker=MARKERS)
rs.visible = False

# add a shape legend with explicit index, set labels to fit your needs
legend = Legend(items=[
    LegendItem(label=MARKERS[i], renderers=[rs], index=i)
         for i, s in enumeratee(MARKERS)],
    location="bottom_right")
p.add_layout(legend)

species_select = CheckboxGroup(
        labels=SPECIES,
        active=list(range(len(SPECIES))))

show(p)

Seems like you’re hitting [BUG] WebGL + CDSView seems to use incorrect marker fill colours · Issue #9230 · bokeh/bokeh · GitHub. I just tested on master and seems like it has not been fixed. Nevermind, I didn’t test it properly. It has indeed been fixed and the fix should be available in the next Bokeh version.

In any case, you can just specify the color explicitly, without having to add it to the data source. Just add it to the call to zip along with others.

Specifying the colors explicitly works great for this example, but unfortunately my actual data set is a bit more complicated. Using analogous terms, I am using multiple colors per species.

I guess for now I will stick to the clunkier way of subsetting the data.

Fortunately, the fix should be out there at the beginning of June, so keep an eye out for it.