Selection Filter w Slider + Altering color theme with Radio Group

I have 2 linked plots with the same datasource: one showing scatter points, another patches. As per my last post (Use a slider to create selection, customjs), I am altering the selection via a slider (or sliders) that move a selection box up/down/left/right.

I have implemented this as desired and am now trying to add a radiogroup widget that will allow changing the color theme of the patches. I’ve successfully implemented the callback for the radiogroup (it works as intended if you never touch the slider), however as soon as I move the slider to filter the selection, the color theme reverts back to its original theme and the radio group no longer functions.

Here is my working reproducible example, built mostly off my last one:

from bokeh.io import output_notebook, show
import numpy as np
from bokeh.layouts import gridplot
from bokeh.models import ColumnDataSource, Patches, Slider, Quad,CustomJS,RadioGroup
from bokeh.plotting import figure
import bokeh

output_notebook()

#points
x = list(range(-20, 21))
y = [abs(xx) for xx in x]

#making patches
N =41
xp = np.linspace(-2, 2, N)
yp = xp**2
xpts = np.array([-.09, -.12, .0, .12,  .09])
ypts = np.array([-.1,   .02, .1, .02, -.1])

source = ColumnDataSource(dict(x=x,y=y,
        xs=[xpts*(1+i/10.0)+xx for i, xx in enumerate(xp)],
        ys=[ypts*(1+i/10.0)+yy for i, yy in enumerate(yp)],
                               cvalsA = list(range(0,41)),
                               cvalsB = list(np.geomspace(0.1,41,41))
    ))

#colortheming dictionary
Amap = bokeh.models.LinearColorMapper(palette='Spectral11', low = 0, high = 41)
Bmap = bokeh.models.LinearColorMapper(palette='Turbo256', low = 0, high = 41)

cdict = {0:{'field':'cvalsA','transform':Amap},1:{'field':'cvalsB','transform':Bmap}}

TOOLS = "box_select,lasso_select"

# create a new plot and add a renderer
left = figure(tools=TOOLS, plot_width=300, plot_height=300, title=None)
left.circle('x', 'y', source=source)

# create another new plot and add a renderer
right = figure(tools=TOOLS, plot_width=300, plot_height=300, title=None)
glyph = Patches(xs="xs", ys="ys", fill_color=cdict[0])
patchrenderer = right.add_glyph(source, glyph)

#create the selection "quad"
qsource = ColumnDataSource({'bottom':[0],'top':[20],'left':[-20],'right':[20]})
selector = Quad(bottom='bottom',top='top',left='left',right='right',fill_color='green',fill_alpha=0.05)
renderer = left.add_glyph(qsource,selector)

hslider = Slider(start=-20, end=20, value=-20, step=1, title="hselector")

hcallback = CustomJS(args=dict(renderer=renderer), code="""
    renderer.glyph.left = cb_obj.value;
""")
hslider.js_on_change('value',hcallback)

rbutton = RadioGroup(labels=['A theme','B theme'], active=0)

selcallback = CustomJS(args=dict(source=source,rbutton=rbutton,r=patchrenderer,cdict=cdict), code="""
        var indices = [];
        for (var i = 0; i <= source.data['x'].length; i++){
            if (source.data['x'][i] > cb_obj.value) {
            indices.push(i)
            }
            };
        var l_selected = source.selected;
        l_selected.indices = indices;
        source.selected = l_selected;
        r.glyph.fill_color = cdict[rbutton.active];
        console.log(r.glyph.fill_color)
        r.change.emit();
        """)
hslider.js_on_change('value',selcallback)


rbutton_callback = CustomJS(args=dict(r=patchrenderer,cdict=cdict),code="""
                            r.glyph.fill_color = cdict[this.active]""")
rbutton.js_on_click(rbutton_callback)

p = gridplot([[left, right],[hslider,rbutton]])
show(p)

See the console.log(r.glyph.fill_color) in the slider callback? Looking at it… it actually shows it as updating correctly… i.e. it returns the correct dictionary entry when i move the slider, then change the radiogroup, then move the slider again:

image

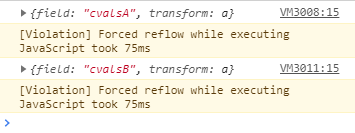
I’m missing something with how bokeh handles the selections…I think. Any help much appreciated.

r.glyph is for a regular glyph when there’s no selection.
Where there is a selection, you may want to use r.selection_glyph and r.nonselection_glyph.

Thx for reply!.. when I console.log(r.selection_glyph) I get a string: ‘auto’. So I can’t just go r.selection_glyph.fill_color = cdict[whatever] because ‘auto’ string has no fill_color property…

hmmm gonna try a few other options with this now though.

Got it!

When you instantiate the renderer w add_glyph(), you need to feed it args for selection_glyph and nonselection glyph:

glyph = Patches(xs="xs", ys="ys", fill_color=cdict[0])
nsglyph = Patches(xs="xs", ys="ys", fill_color=cdict[0],fill_alpha=0.1)

patchrenderer = right.add_glyph(source, glyph
                                ,selection_glyph=glyph
                                ,nonselection_glyph=nsglyph)

This makes the renderer NOT have ‘auto’ for the selection_glyph/nonselection_glyph properties, but actual legitimate glyphs that actually have a fill_color assigned to them. These selection/nonselection glyphs seem to both obey the fill color assigned to the whole renderer, which gets changed when i change the button.

So I don’t need to even use r.glyph.selection_glyph etc. in the selection callback at all!

from bokeh.io import output_notebook, show
import numpy as np
from bokeh.layouts import gridplot
from bokeh.models import ColumnDataSource, Patches, Slider, Quad,CustomJS,RadioGroup
from bokeh.plotting import figure
import bokeh

output_notebook()

#points
x = list(range(-20, 21))
y = [abs(xx) for xx in x]

#making patches
N =41
xp = np.linspace(-2, 2, N)
yp = xp**2
xpts = np.array([-.09, -.12, .0, .12,  .09])
ypts = np.array([-.1,   .02, .1, .02, -.1])

source = ColumnDataSource(dict(x=x,y=y,
        xs=[xpts*(1+i/10.0)+xx for i, xx in enumerate(xp)],
        ys=[ypts*(1+i/10.0)+yy for i, yy in enumerate(yp)],
                               cvalsA = list(range(0,41)),
                               cvalsB = list(np.geomspace(0.1,41,41))
    ))

#colortheming dictionary
Amap = bokeh.models.LinearColorMapper(palette='Spectral11', low = 0, high = 41)
Bmap = bokeh.models.LinearColorMapper(palette='Turbo256', low = 0, high = 41)

cdict = {0:{'field':'cvalsA','transform':Amap},1:{'field':'cvalsB','transform':Bmap}}

TOOLS = "box_select,lasso_select"

# create a new plot and add a renderer
left = figure(tools=TOOLS, plot_width=300, plot_height=300, title=None)
left.circle('x', 'y', source=source)

# create another new plot and add a renderer
right = figure(tools=TOOLS, plot_width=300, plot_height=300, title=None)

glyph = Patches(xs="xs", ys="ys", fill_color=cdict[0])
nsglyph = Patches(xs="xs", ys="ys", fill_color=cdict[0],fill_alpha=0.1)

patchrenderer = right.add_glyph(source, glyph
                                ,selection_glyph=glyph
                                ,nonselection_glyph=nsglyph)

#create the selection "quad"
qsource = ColumnDataSource({'bottom':[0],'top':[20],'left':[-20],'right':[20]})
selector = Quad(bottom='bottom',top='top',left='left',right='right',fill_color='green',fill_alpha=0.05)
renderer = left.add_glyph(qsource,selector)


hslider = Slider(start=-20, end=20, value=-20, step=1, title="hselector")

hcallback = CustomJS(args=dict(renderer=renderer), code="""
    renderer.glyph.left = cb_obj.value;
""")
hslider.js_on_change('value',hcallback)

rbutton = RadioGroup(labels=['A theme','B theme'], active=0)

selcallback = CustomJS(args=dict(source=source,rbutton=rbutton
                                 ,glyph=glyph
                                 ,r=patchrenderer
                                 ,cdict=cdict), code="""
        var indices = [];
        for (var i = 0; i <= source.data['x'].length; i++){
            if (source.data['x'][i] > cb_obj.value) {
            indices.push(i)
            }
            };
        var l_selected = source.selected;
        l_selected.indices = indices;
        source.selected = l_selected;
        """)

hslider.js_on_change('value',selcallback)


rbutton_callback = CustomJS(args=dict(r=patchrenderer.glyph,cdict=cdict),code="""
                            r.fill_color = cdict[this.active]""")
rbutton.js_on_click(rbutton_callback)

p = gridplot([[left, right],[hslider,rbutton]])
show(p)

Thanks so much for that clue!