Hello,
I have a follow up question for my last one (Ploting Problems with stacked Plot (varea_stack))
So I have a vbar_stack plot in a standalone html file (so bokeh without a server) and I added a checkBox group to switch each stacker of the plot on or off.
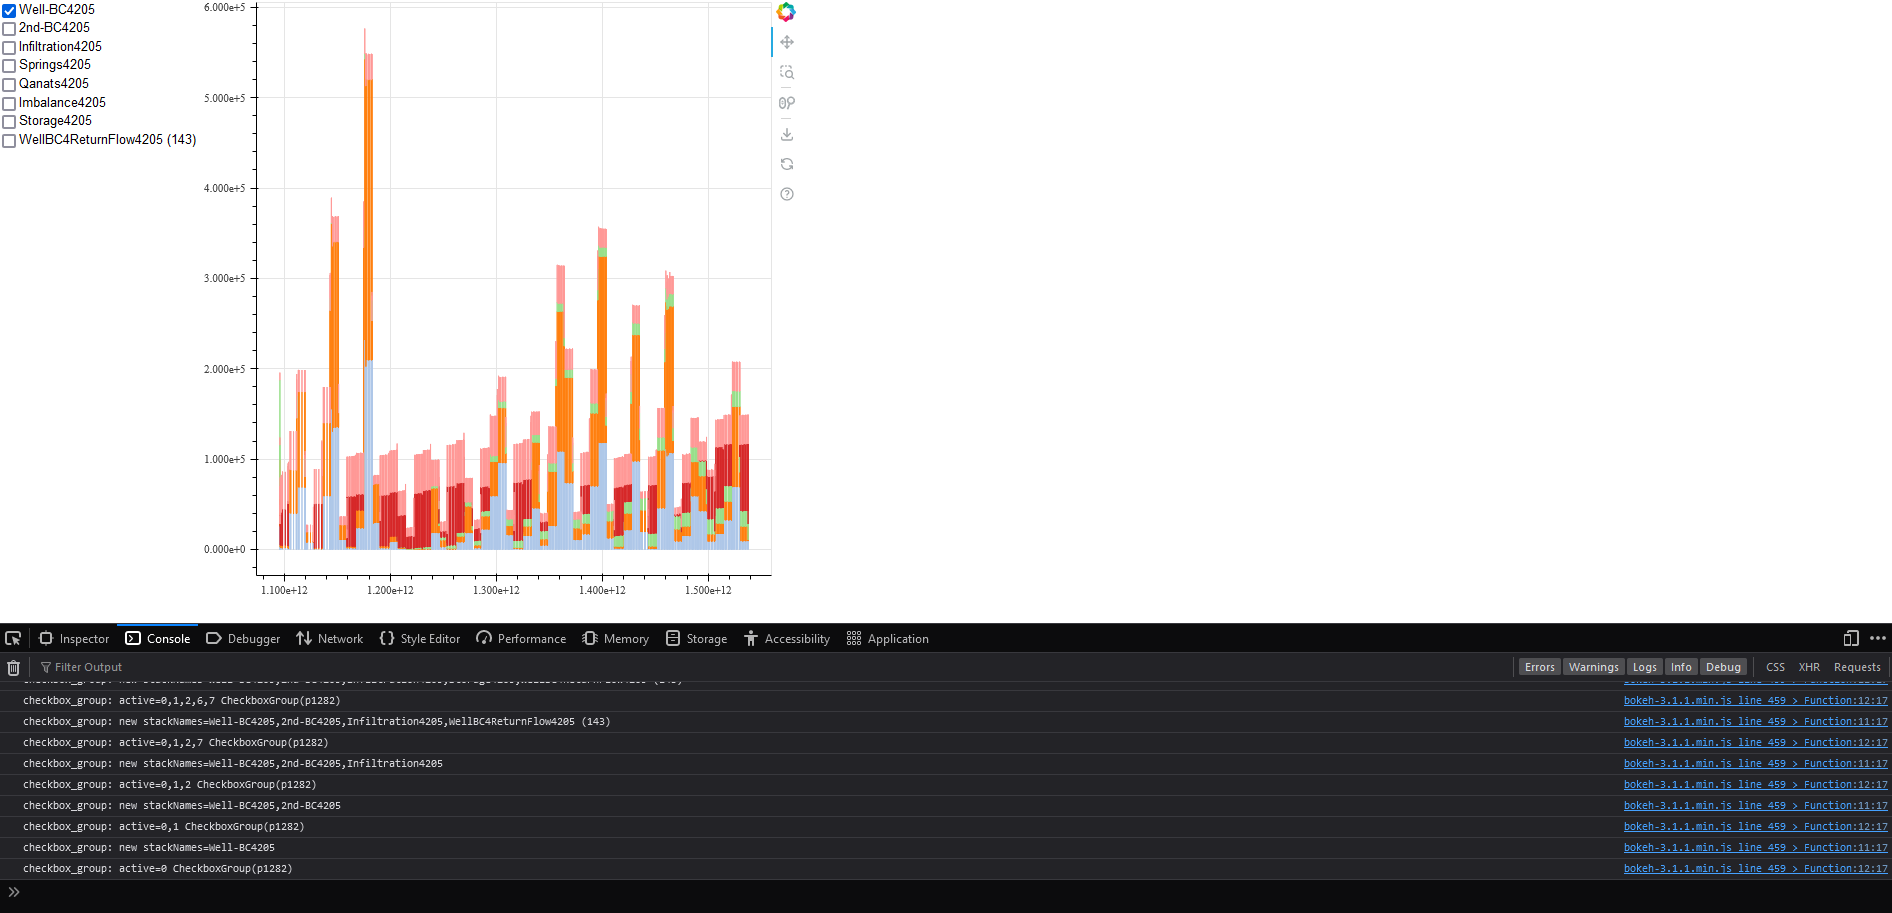
My goal is to update the bar plot, that it only shows the checked stackers (or plot it new , with only the checked stackers)
My code to do this looks like this:
from bokeh.layouts import column, row
from bokeh.plotting import figure, output_file, save, show
from bokeh.palettes import brewer, d3
from bokeh.io import export_png
from bokeh.models import DatetimeTickFormatter, Select, Legend, CustomJS, CheckboxGroup, PreText, ColumnDataSource, CDSView, IndexFilter

stackNames = ['Well-BC4205','2nd-BC4205','Infiltration4205','Springs4205','Qanats4205','Imbalance4205','Storage4205','WellBC4ReturnFlow4205 (143)']
stackPlot = figure()
stackPlot.xaxis.formatter = DatetimeTickFormatter()
checkBox = CheckboxGroup(labels=stackNames, active=[0,1])
checkBox.js_on_change('active', CustomJS(args=dict(stackNames=stackNames), code="""
        const stk = [];
        for (const i of this.active) {
            stk.push(stackNames[i]);
        }
        stackNames = stk;
        //stackNames.change.emit();
        console.log('checkbox_group: new stackNames=' + stackNames);
        console.log('checkbox_group: active=' + this.active, this.toString());
    """))

sp = stackPlot.vbar_stack(stackers=stackNames, x="date", color=d3['Category20'][len(stackNames)], source=tPos)

bundle = row(checkBox, stackPlot)
show(bundle)
so i thought I could just update stackNames in a CustomJS, but with the code above this isn’t working. I can see from the console.log output, that stackNames got changed in the way i wanted it. But it doesnt affect the plot at all.
My source is a pd.DataFrame which looks like this:
                   date  ... WellBC4ReturnFlow4205 (143)
0   2004-09-22 00:00:00  ...                 8369.992188
1   2004-09-22 00:00:00  ...                 8369.992188
2   2004-09-22 00:00:00  ...                 8369.992188
3   2004-09-22 00:00:00  ...                 8369.992188
4   2004-09-22 00:00:00  ...                 8369.992188
..                  ...  ...                         ...
792 2018-08-22 00:59:00  ...                32149.527344
793 2018-09-01 00:25:00  ...                32149.527344
794 2018-09-20 00:59:00  ...                32149.527344
795 2018-09-21 00:59:00  ...                32149.527344
796 2018-09-22 00:59:00  ...                32149.527344
[797 rows x 11 columns]
so except for the first 3 columns, each column name is a stacker in the plot, and represented in the CheckBoxGroup.
What am I doing wrong? Or is it even possible what I try here? A bokeh server is sadly no option for me.